canvas绘制折线图(仿echarts)
Posted lyyyyy
tags:
篇首语:本文由小常识网(cha138.com)小编为大家整理,主要介绍了canvas绘制折线图(仿echarts)相关的知识,希望对你有一定的参考价值。
遇到的问题:Retina屏上字体线条模糊问题
解决方案:放大canvas的大小,然后用css压缩回原大小,例如:想要900*400的画布,先将画布设置为 width="1800px" height="800px",再用css {width: 900px;height: 400px;}压缩。
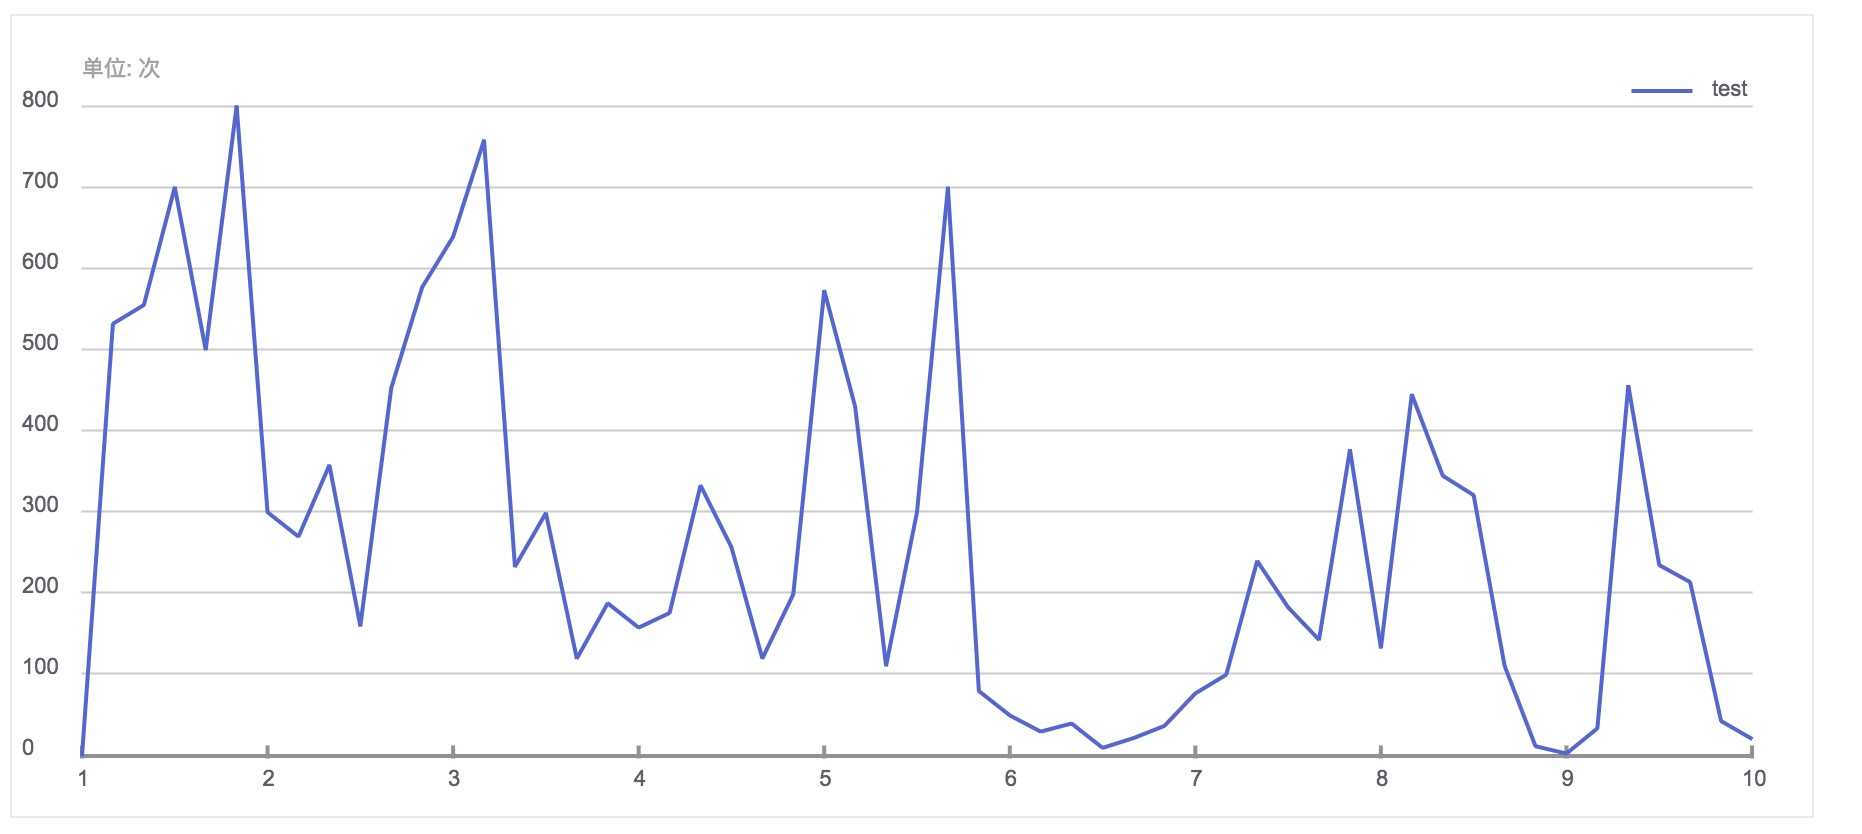
最终效果如下图:

代码:
  1 <!DOCTYPE html>
  2 <html lang="en">
  3 <head>
  4     <meta charset="UTF-8">
  5     <title>echarts绘制</title>
  6 </head>
  7 <body>
  8     <canvas id="canvas" width="1800px" height="800px" style="border: 1px solid #ebebed;width: 900px;height: 400px;"></canvas>
  9     <script>
 10         var scale = 2;
 11         var canvas = document.getElementById(‘canvas‘);
 12         var config = {
 13             width: canvas.width,
 14             height: canvas.height,
 15             Left: 70,
 16             Top: 90,
 17             Right: 30,
 18             Bottom: 60,
 19             color: ["#5266d7"],
 20             yLine:{
 21                 splitcount: 8,
 22                 data:[0,100,200,300,400,500,600,700,800]
 23             },
 24             xLine:{
 25                 splitcount: 9,
 26                 data:[1,2,3,4,5,6,7,8,9,10]
 27             },
 28             series:{
 29                 data:[0, 532, 555, 700, 500, 800, 300, 270, 358, 160, 453, 577, 639, 758, 233, 299, 120, 188, 158, 176, 333, 257, 120, 199, 573, 430, 111, 300, 700, 80, 50, 30, 40, 10, 22, 37, 77, 100, 240, 183, 143, 377, 133, 445, 345, 321, 111,12,3,34,456,235,214,43,21]
 30             }
 31         }
 32         var ctx = canvas.getContext(‘2d‘);
 33         // 绘制title
 34         drawText(‘单位: 次‘, config.Left, config.Top - 30, ‘normal 22px Arial‘, ‘#a3a2a7‘);
 35         // 绘制网格线
 36         darwBackLine(‘#cccccc‘, config.yLine.splitcount, 1, config.yLine.data);
 37         // 绘制x轴
 38         drawXLine(‘#939099‘, config.xLine.splitcount, 2, config.xLine.data);
 39         // 绘制线条
 40         drawLines(config.color[0], 2,config.series.data);
 41         // 绘制图例
 42         drawItem(‘test‘, config.color[0], 2);
 43
 44
 45         function darwBackLine(color, splitcount, linewidth, data) {
 46             var len = Math.floor((config.height - config.Top - config.Bottom)/splitcount);
 47             var start = config.Top;
 48             for (var i = 0; i < splitcount; i++) {
 49                 var point = start+len*i;
 50                 drawLine(config.Left, point, (config.width/2 - config.Right)*scale, point, color, linewidth);
 51                 drawText(data[splitcount-i], 10, point, ‘normal 22px Arial‘, ‘#605d68‘);
 52             }
 53             drawText(data[splitcount-i], 10, point+len, ‘normal 22px Arial‘, ‘#605d68‘);
 54         }
 55
 56         function drawXLine(color, splitcount, linewidth, data) {
 57             var left = config.Left;
 58             var top = config.height - config.Bottom;
 59             var right = (config.width/2 - config.Right)*scale;
 60             drawLine(config.Left, top, right, top, color, linewidth);
 61             var len = (right - left)/splitcount;
 62
 63             for (var i = 0; i < splitcount+1; i++) {
 64                 var xpoint = left+len*i;
 65                 drawLine(xpoint,top+linewidth,xpoint, top-5*scale, color, linewidth);
 66                 var PanningLeft = data[i].toString().length*5;
 67                 drawText(data[i], xpoint-PanningLeft, top+15*scale, ‘normal 22px Arial‘, ‘#605d68‘)
 68             }
 69         }
 70
 71         function drawLines(color, linewidth, data) {
 72             var count = data.length;
 73             var left = config.Left;
 74             var top = config.height - config.Bottom;
 75             var right = (config.width/2 - config.Right)*scale;
 76             var len = (right - left)/(count - 1);
 77             var i = 0;
 78
 79             var interval = setInterval(function() {
 80                 if(i >= count - 1){
 81                     clearInterval(interval);
 82                     return;
 83                 }
 84                 drawLine(left+len*i, top-(data[i]/800)*(top - config.Top), left+len*(i+1), top-(data[i+1]/800)*(top - config.Top), color, linewidth, ‘bevel‘);
 85                 i++;
 86             }, 30);
 87         }
 88
 89         function drawItem(text, color, linewidth) {
 90             var right = (config.width/2 - config.Right)*scale;
 91             var left = right-(text.length*10);
 92             drawText(text, left, config.Top - 10, ‘normal 22px Arial‘, ‘#605d68‘);
 93             drawLine(left-20, config.Top - 15, left-80, config.Top - 15, color, linewidth);
 94         }
 95
 96         function drawLine(startX, startY, endX, endY, color, width, lineJoin) {
 97             ctx.beginPath();
 98             ctx.moveTo(startX, startY);
 99             ctx.lineTo(endX, endY);
100             if(color){
101                 ctx.strokeStyle = color
102             }
103
104             if(width){
105                 ctx.lineWidth = width*scale;
106             }
107
108             if(lineJoin){
109                 ctx.lineJoin = lineJoin;
110             }
111
112             ctx.closePath();
113             ctx.stroke();
114         }
115
116         function drawText(text, x, y, font, color) {
117             ctx.font= font;
118             ctx.fillStyle= color;
119             ctx.fillText(text, x, y);
120         }
121     </script>
122 </body>
123 </html>
以上是关于canvas绘制折线图(仿echarts)的主要内容,如果未能解决你的问题,请参考以下文章