项目 数据可视化6
Posted zhulvbo
tags:
篇首语:本文由小常识网(cha138.com)小编为大家整理,主要介绍了项目 数据可视化6相关的知识,希望对你有一定的参考价值。
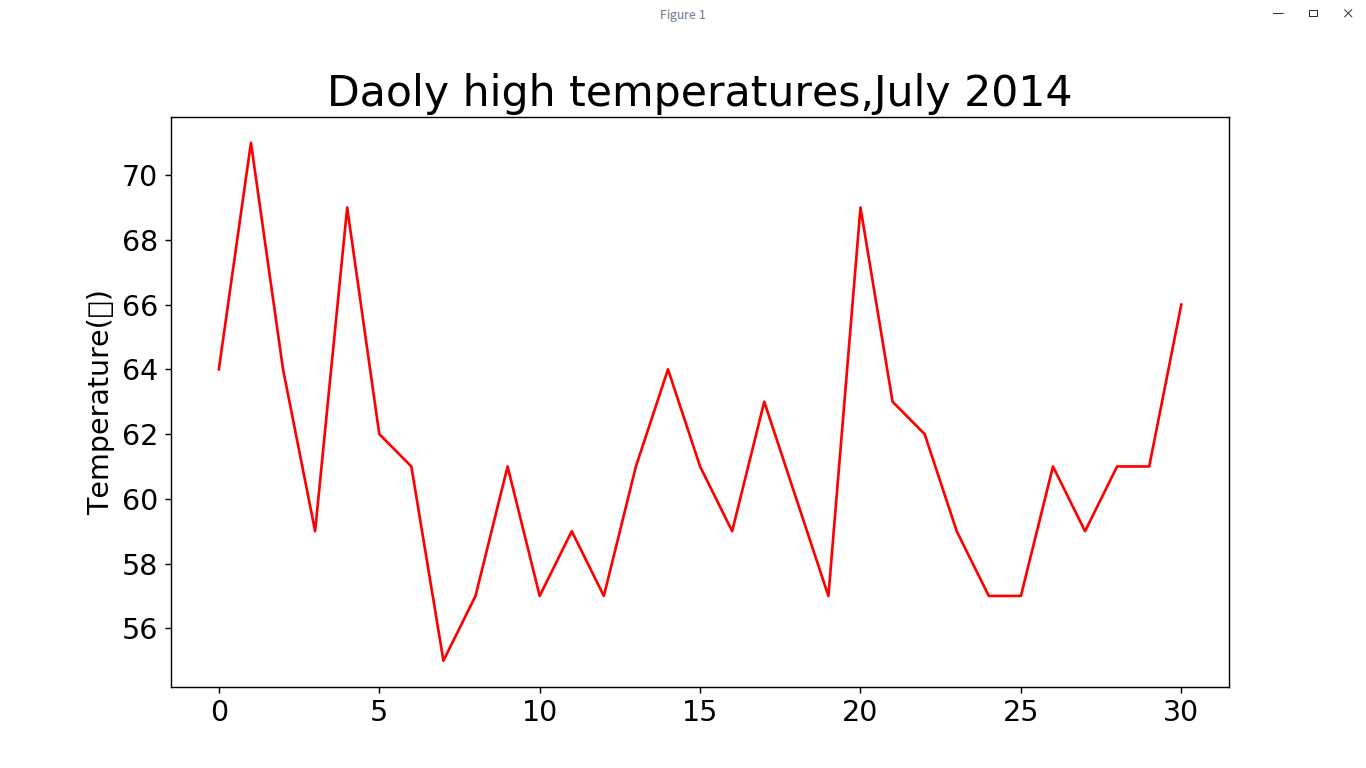
 1 import csv
 2
 3 from matplotlib import pyplot as plt
 4
 5 filename = ‘sitka_weather_07-2014.csv‘
 6
 7 with open(filename) as f:
 8     reader = csv.reader(f)
 9     header_row = next(reader)
10
11
12     highs =[]
13     for row in reader:
14         high = int(row[1])
15         highs.append(high)
16
17
18 fig = plt.figure(dpi=128,figsize=(10,6))
19 plt.plot(highs,c=‘red‘)
20
21 plt.title("Daoly high temperatures,July 2014",fontsize=24)
22 plt.xlabel("",fontsize=16)
23 plt.ylabel("Temperature(F)",fontsize=16)
24 plt.tick_params(axis=‘both‘,which=‘major‘,labelsize=16)
25
26 plt.show()
import csv
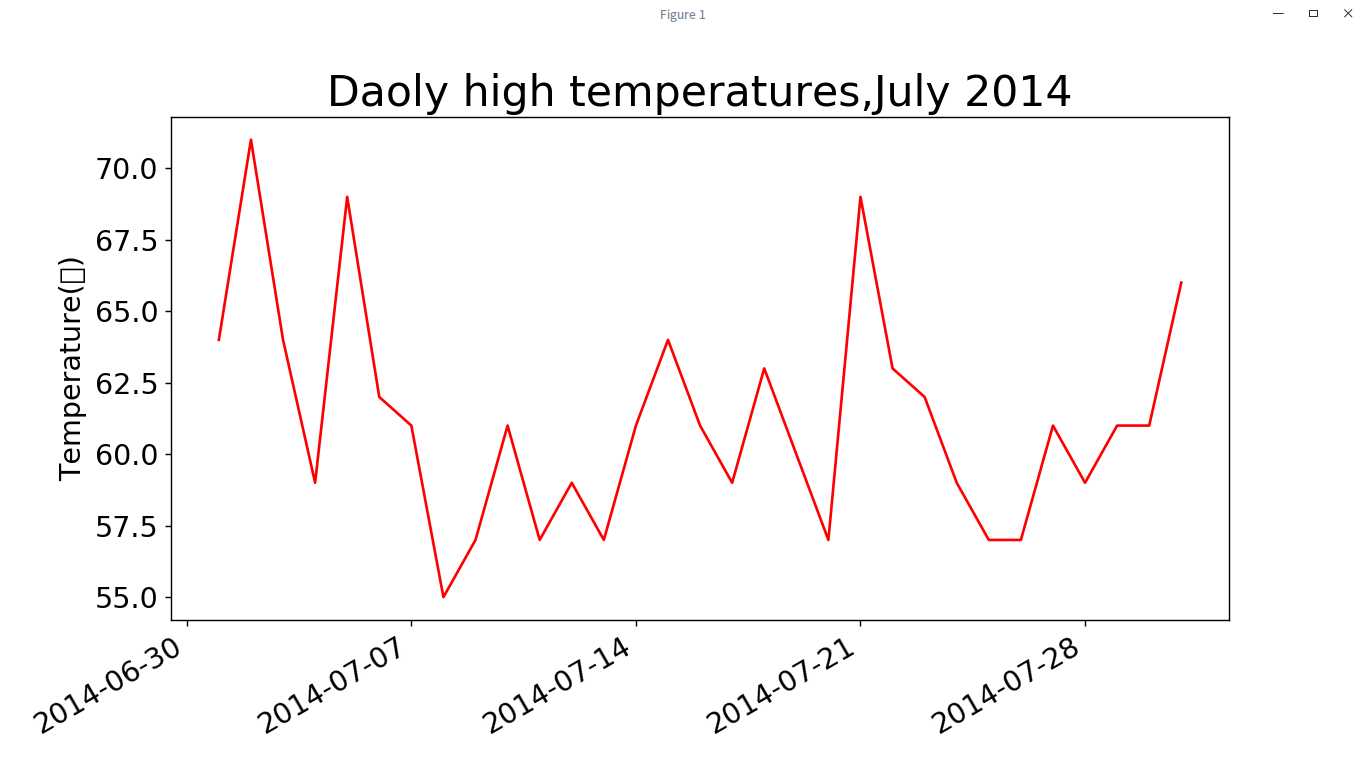
from datetime import datetime
from matplotlib import pyplot as plt
filename = ‘sitka_weather_07-2014.csv‘
with open(filename) as f:
reader = csv.reader(f)
header_row = next(reader)
dates,highs=[],[]
for row in reader:
current_date = datetime.strptime(row[0], "%Y-%m-%d")
dates.append(current_date)
high = int(row[1])
highs.append(high)
fig = plt.figure(dpi=128,figsize=(10,6))
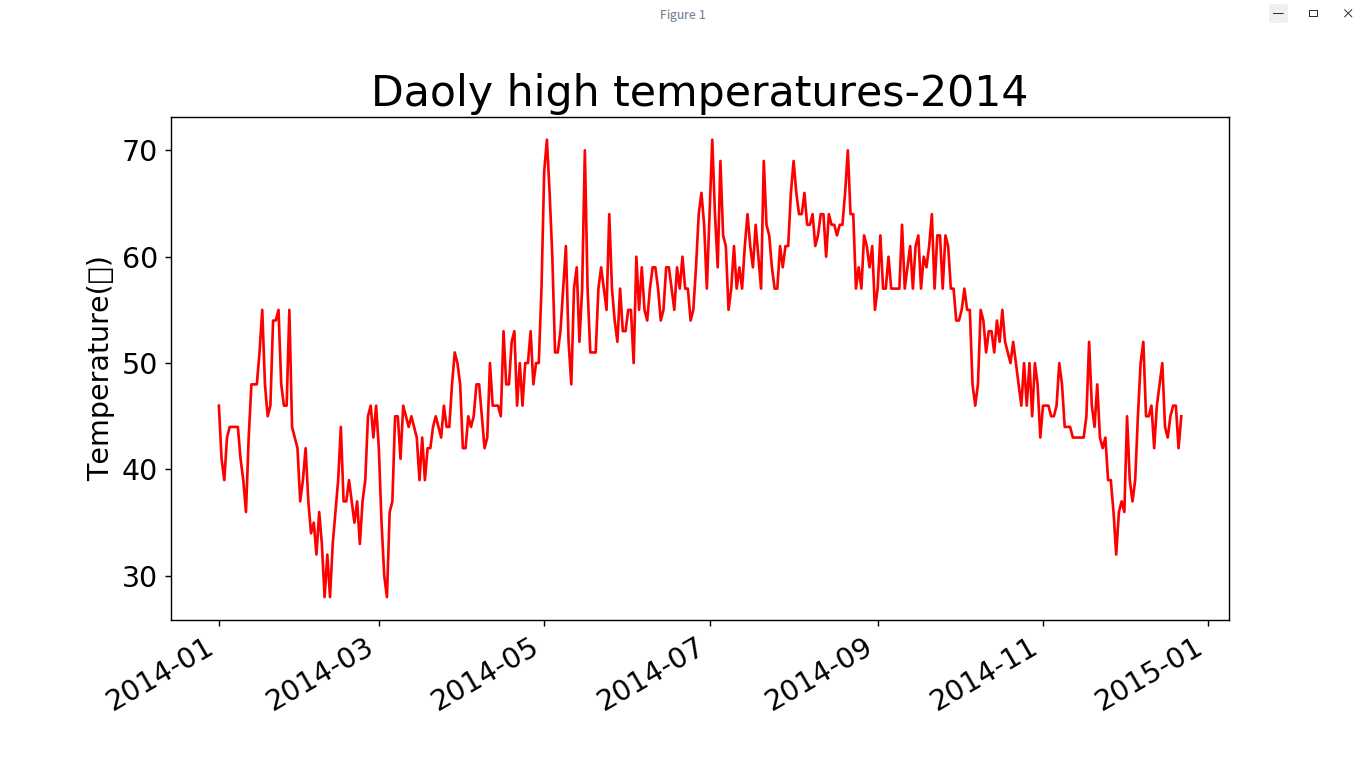
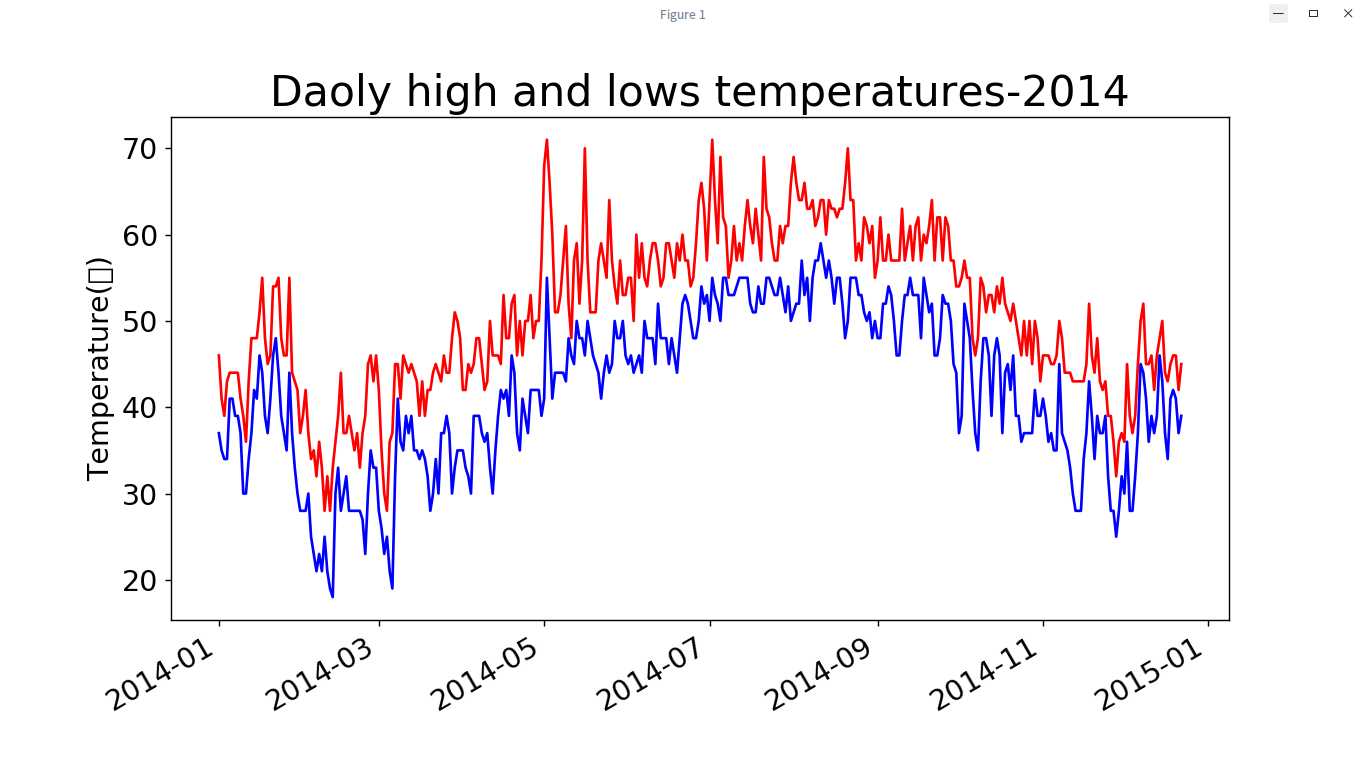
plt.plot(dates,highs,c=‘red‘)
plt.title("Daoly high temperatures,July 2014",fontsize=24)
plt.xlabel("",fontsize=16)
fig.autofmt_xdate()
plt.ylabel("Temperature(F)",fontsize=16)
plt.tick_params(axis=‘both‘,which=‘major‘,labelsize=16)
plt.show()
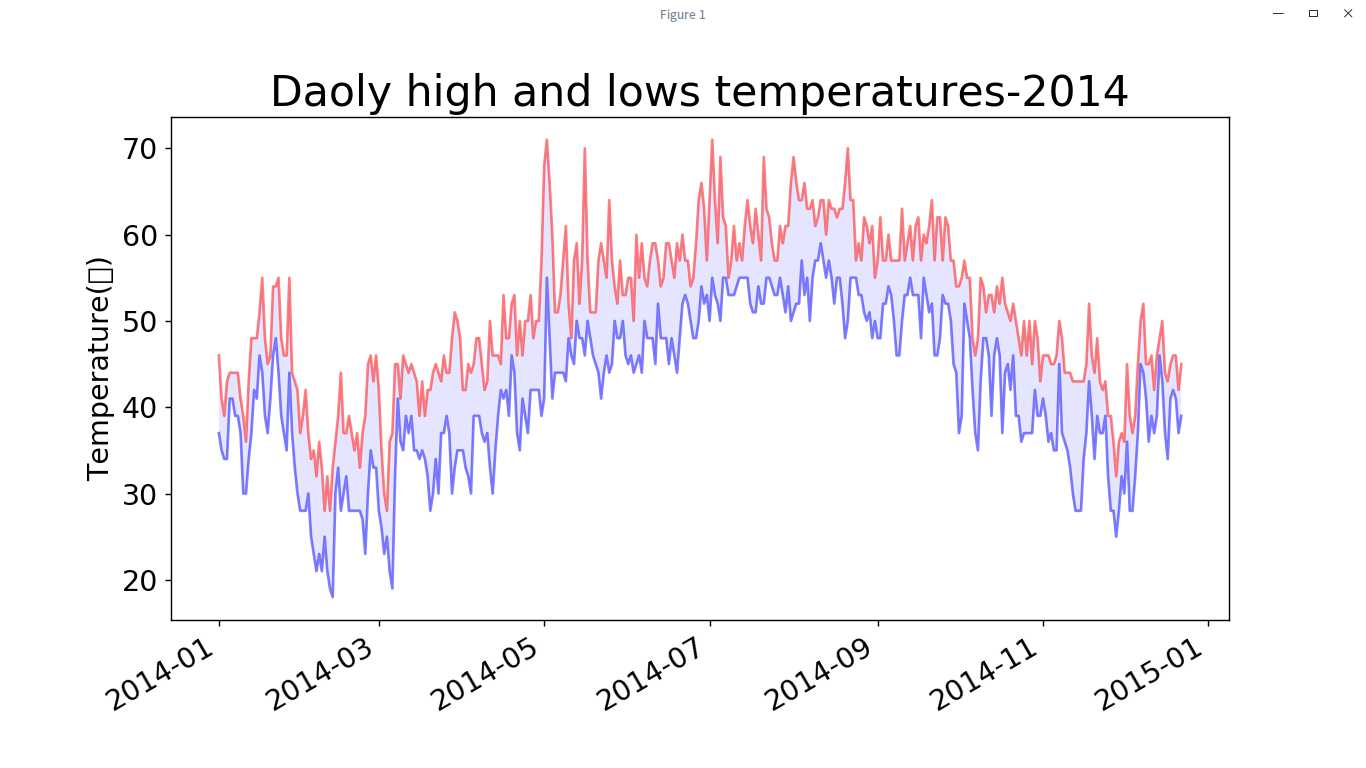
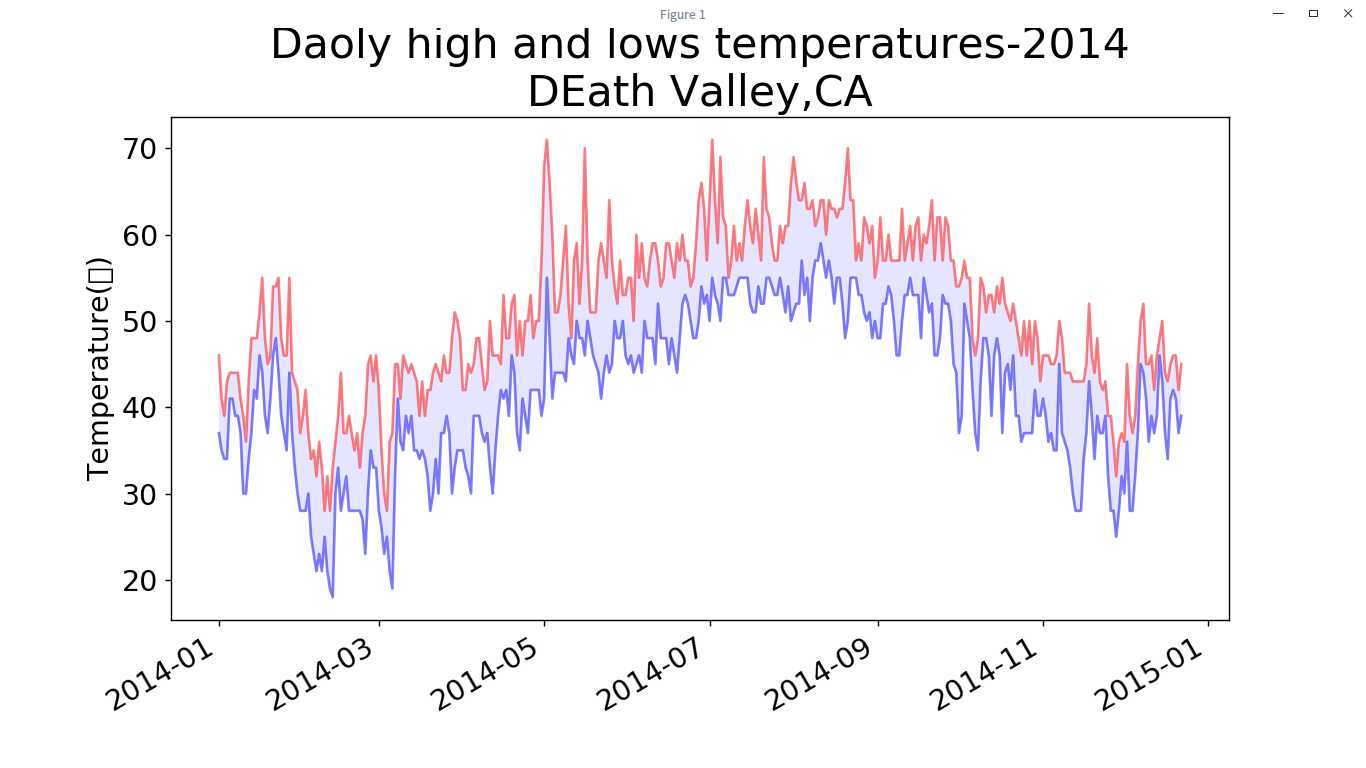
以上是关于项目 数据可视化6的主要内容,如果未能解决你的问题,请参考以下文章