项目 数据可视化3
Posted zhulvbo
tags:
篇首语:本文由小常识网(cha138.com)小编为大家整理,主要介绍了项目 数据可视化3相关的知识,希望对你有一定的参考价值。
2018-04-23
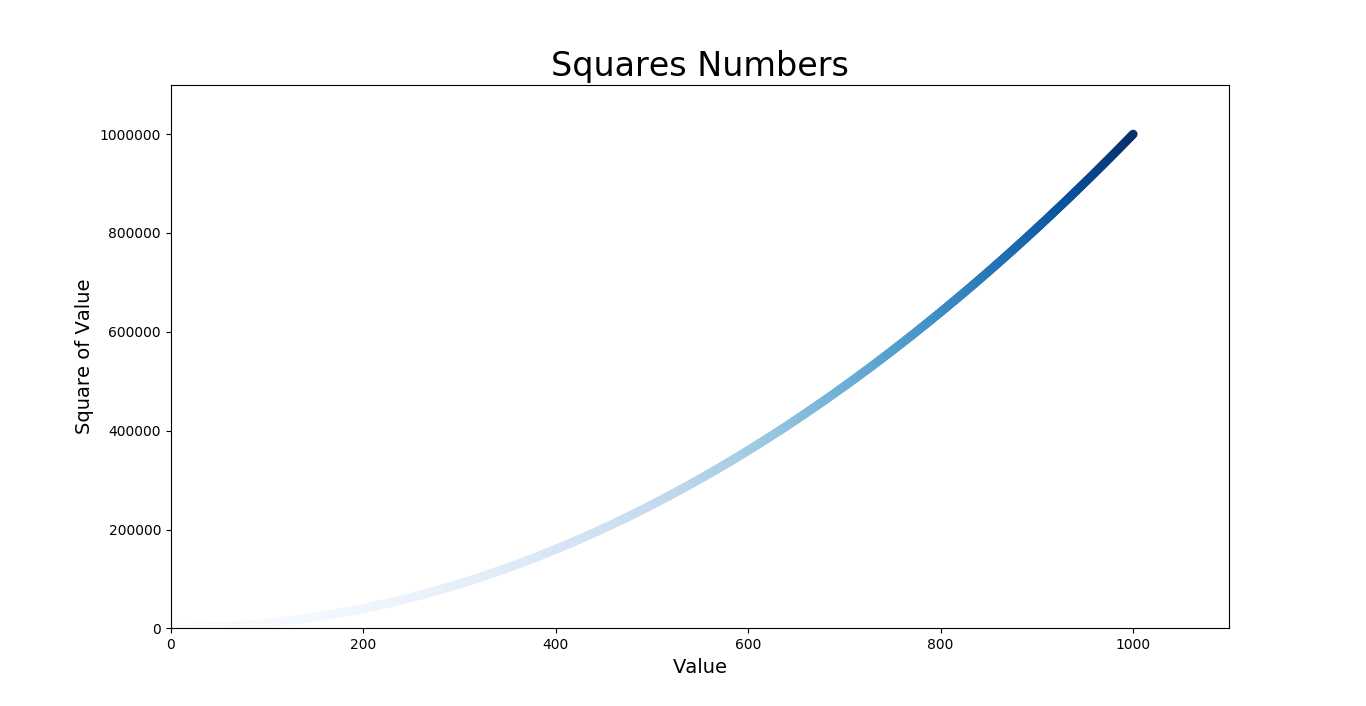
 1 import matplotlib.pyplot as plt
 2
 3 x_values=list(range(1,1001))
 4 y_values=[x**2 for x in x_values]
 5
 6 plt.scatter(x_values,y_values,c=y_values,cmap=plt.cm.Blues,edgecolor=‘none‘,s=40)
 7 # 设置图表标题,并给坐标轴加上标签
 8 plt.title("Squares Numbers",fontsize=24)
 9 plt.xlabel("Value",fontsize=14)
10 plt.ylabel("Square of Value",fontsize=14)
11
12 plt.axis([0,1100,0,1100000])
13
14 plt.show()


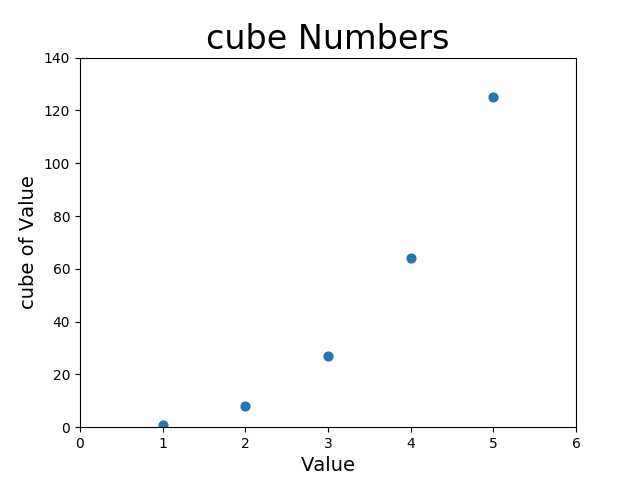
 1 import matplotlib.pyplot as plt
 2
 3 x_values=list(range(1,6))
 4 y_values=[x**3 for x in x_values]
 5
 6 plt.scatter(x_values,y_values,s=40)
 7 # 设置图表标题,并给坐标轴加上标签
 8 plt.title("cube Numbers",fontsize=24)
 9 plt.xlabel("Value",fontsize=14)
10 plt.ylabel("cube of Value",fontsize=14)
11
12 plt.axis([0,6,0,140])
13
14 plt.show()

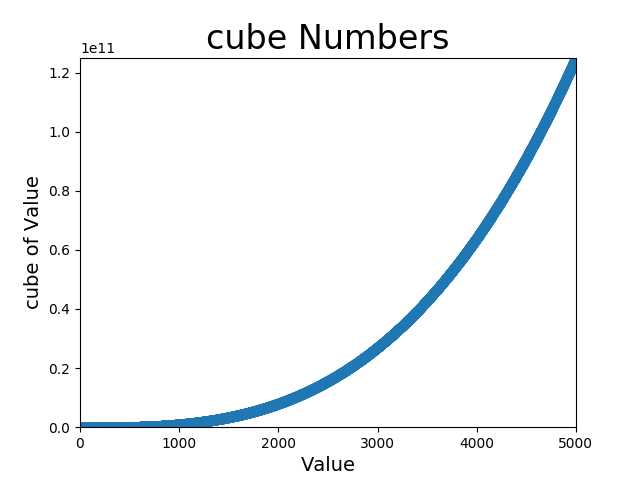
import matplotlib.pyplot as plt
x_values=list(range(1,5001))
y_values=[x**3 for x in x_values]
plt.scatter(x_values,y_values,s=40)
# 设置图表标题,并给坐标轴加上标签
plt.title("cube Numbers",fontsize=24)
plt.xlabel("Value",fontsize=14)
plt.ylabel("cube of Value",fontsize=14)
plt.axis([0,5001,0,5001**3])
plt.show()
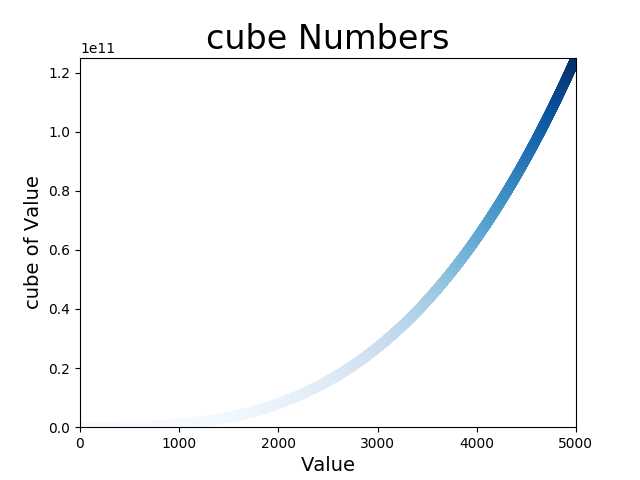
import matplotlib.pyplot as plt
x_values=list(range(1,5001))
y_values=[x**3 for x in x_values]
plt.scatter(x_values,y_values,c=y_values, cmap=plt.cm.Blues,s=40)
# 设置图表标题,并给坐标轴加上标签
plt.title("cube Numbers",fontsize=24)
plt.xlabel("Value",fontsize=14)
plt.ylabel("cube of Value",fontsize=14)
plt.axis([0,5001,0,5001**3])
plt.show()

2018-04-23 20:08:44
以上是关于项目 数据可视化3的主要内容,如果未能解决你的问题,请参考以下文章