ZingChart 图表插件
Posted Ryan.zheng
tags:
篇首语:本文由小常识网(cha138.com)小编为大家整理,主要介绍了ZingChart 图表插件相关的知识,希望对你有一定的参考价值。
ZingChart提供了一个丰富的API,用于通过重新绘制绘图(重新加载)
,加载新数据(setseriesdata),修改现有图表(modifyplot),
放大数据范围(zoomto),切换各种交互功能(togglelegend)等等。
如何修改ZingChart图表的方法:https://www.zingchart.com/docs/api/methods/
不刷新页面修改图表:
1. 第23行代码中的newData不能加中括号,因为json返回的数据已经自带中括号了,如果加上,图表无法显示。
json内容如下:
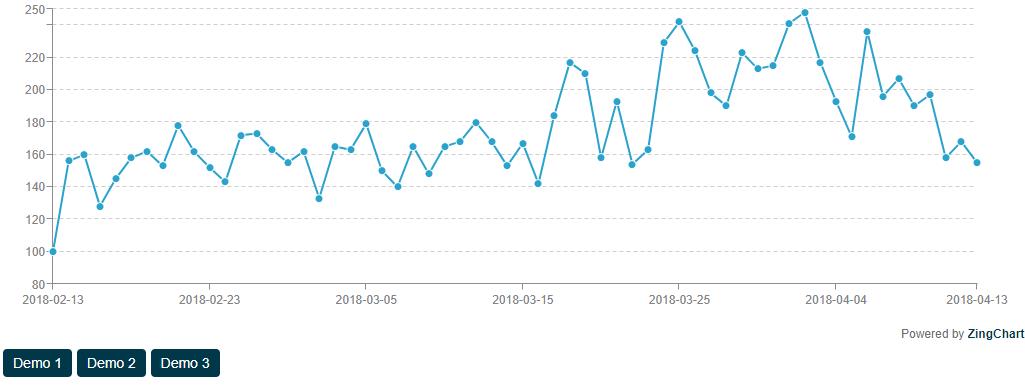
{"data":[100,156,160,128,145,158,162,153,178,162,152,143,172,173,163,155,162,133,165,163,179,150,

140,165,148,165,168,180,168,153,167,142,184,217,210,158,193,154,163,229,242,224,198,190,223,

213,215,241,248,217,193,171,236,196,207,190,197,158,168,155]}
 1 $(\'#demo3\').bind(\'click\', function() {
 2         $.get( \'test2_data.php\', function() {})
 3
 4         .done(function(res){
 5
 6             var newData = res.data;
 7             zingchart.exec(\'demo-chart\', \'setdata\', {
 8                 \'data\': {
 9                      "type":"line",
10                     "plot": {
11                     "tooltip": {
12                       "text": "Orders: <strong style=\'font-size:11px;\'>%vt</strong> \\n %kt"
13                     }
14                   },
15                   "scale-y": {
16                         "values":"<?php echo $sales_de_qty_max; ?>:<?php echo $sales_de_qty_min; ?>:10"
17                     },
18                     "title":{ "text":"test" },
19                     "subtitle":{ "text":"test" },
20                     "scale-x":{ "values":[<?php echo $test; ?>], "zooming":true,},
21                     "scroll-x":{  },
22                     "series":[ { "values": newData} ]
23                 }
24               });
25         });
2. 可以在html中添加按钮的方式,在加上第1点中的javascript代码实现数据的异步加载。
php文件的代码如下:
<?php
    header(\'Content-type: text/json\');
        $data = array (
        "data"  => array(12, 10, ...)

    );
        echo json_encode($data);
<button class=\'btn btn-info\' id=\'demo3\'>Demo 3</button>
3. "x" 表示距离横坐标原点的距离,"y" 表示距离纵坐标原点的距离
 1 {
 2                                 "type":"line",
 3                                 "height":"100%",
 4                                 "width":"22%",
 5                                 "x":"50%",
 6                                 "y":"1%",
 7                                 "title":{ "text":"DE Free Orders" },
 8                                 "subtitle":{ "text":"Last 30 Days Average: <?php echo $sales_de_qty_free_avg_lst30; ?> " },
 9                                 "scale-x":{ "values":[<?php echo $sales_de_date_free; ?>], "zooming":true,},
10                                 "scroll-x":{  },
11                                 "series":[ { "values": [<?php  echo $sales_de_qty_free; ?>]} ]
12                         },
以上是关于ZingChart 图表插件的主要内容,如果未能解决你的问题,请参考以下文章