Seaborn Tutorial
Introduction
在数据分析中,画图极为重要。在分析过程中以及最后的分析结果中都需要利用直观的图表去分析,展示数据特点,以便挖掘出有价值的信息。
因为我是用Python分析数据,那么matplotlib必不可少,然而自己太懒,matplotlib细节太多,一时没法完全掌握。Seaborn看起来是个不错的选择,它基于matplotlib,
但是做了更高层次的封装,学起来会简单很多,所以我把它当做绘图入门的工具。
我打算做一个Seaborn文档的笔记,然后再附一两篇实际应用的案例来完成我的Seaborn入门之旅。
import numpy as np
import matplotlib.pyplot as plt
import seaborn as sns
%matplotlib inline
plt.style.use({\'figure.figsize\':(12, 8)})
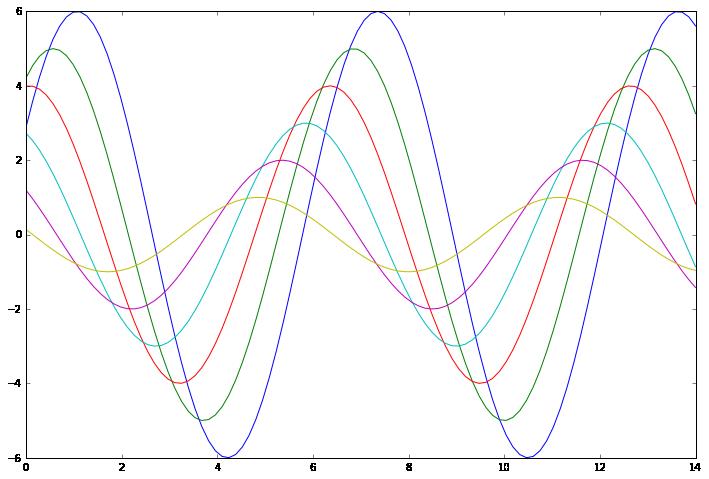
接下来画一些正弦函数来看一下Seaborn的基本参数:
def sinplot(flip=1):
    x = np.linspace(0, 14, 100)
    for i in range(1, 7):
        plt.plot(x, np.sin(x + i * .5) * (7 - i) * flip)
sinplot()
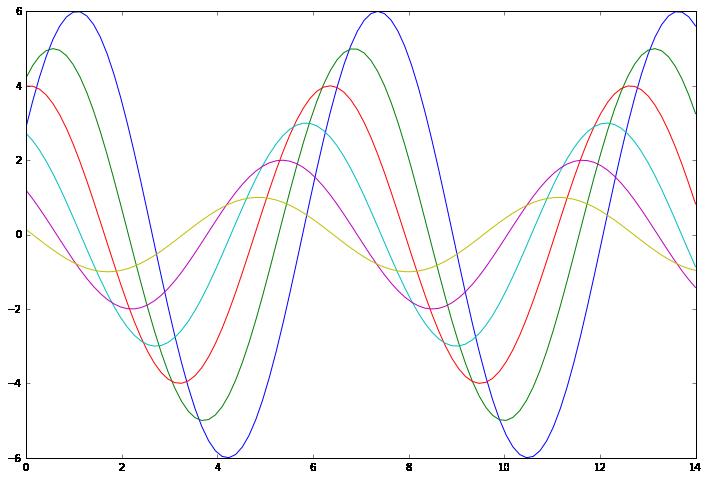
看看matplotlib的样式:
print(plt.style.available)
[\'bmh\', \'classic\', \'dark_background\', \'fivethirtyeight\', \'ggplot\', \'grayscale\', \'seaborn-bright\', \'seaborn-colorblind\', \'seaborn-dark-palette\', \'seaborn-dark\', \'seaborn-darkgrid\', \'seaborn-deep\', \'seaborn-muted\', \'seaborn-notebook\', \'seaborn-paper\', \'seaborn-pastel\', \'seaborn-poster\', \'seaborn-talk\', \'seaborn-ticks\', \'seaborn-white\', \'seaborn-whitegrid\', \'seaborn\', \'_classic_test\']
可以看到,Seaborn的样式已经嵌入其中。我们将样式设置为Seaborn:
sns.set()
sinplot()
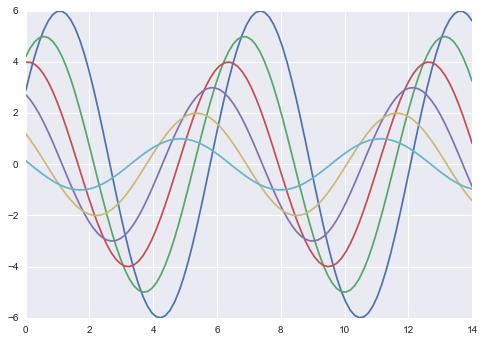
Seaborn将matplotlib的参数分为两个部分,一控制样式,一控制图中各种元素显示的比例。
Seaborn figure styles
plt.style.available
[\'bmh\',
 \'classic\',
 \'dark_background\',
 \'fivethirtyeight\',
 \'ggplot\',
 \'grayscale\',
 \'seaborn-bright\',
 \'seaborn-colorblind\',
 \'seaborn-dark-palette\',
 \'seaborn-dark\',
 \'seaborn-darkgrid\',
 \'seaborn-deep\',
 \'seaborn-muted\',
 \'seaborn-notebook\',
 \'seaborn-paper\',
 \'seaborn-pastel\',
 \'seaborn-poster\',
 \'seaborn-talk\',
 \'seaborn-ticks\',
 \'seaborn-white\',
 \'seaborn-whitegrid\',
 \'seaborn\',
 \'_classic_test\']
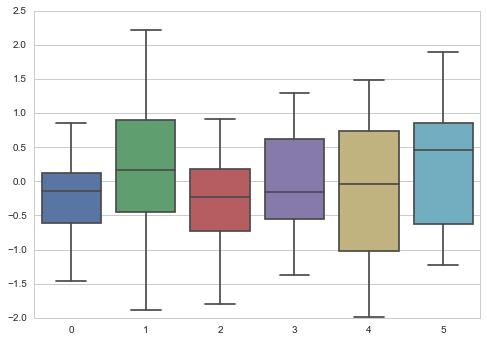
Matplotlib已经嵌入了 Seaborn样式,尝试一下不同的样式:
data = np.random.normal(size=(20, 6))
sns.set_style(\'whitegrid\')
sns.boxplot(data=data)
<matplotlib.axes._subplots.AxesSubplot at 0x1fbc03d6780>
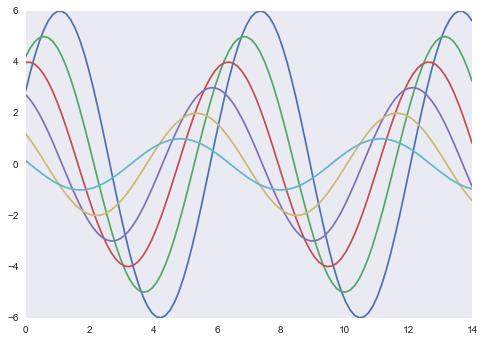
sns.set_style(\'dark\')
sinplot()
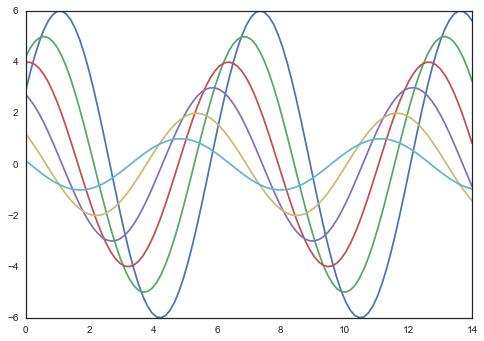
sns.set_style(\'white\')
sinplot()
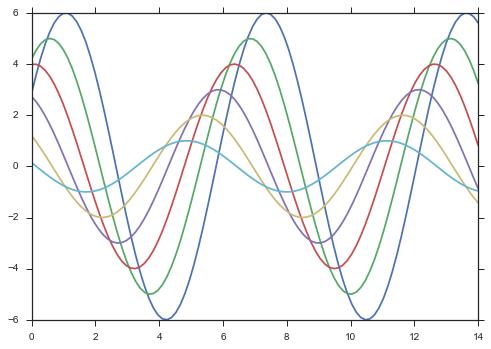
sns.set_style(\'ticks\')
sinplot()
Remove axes spines
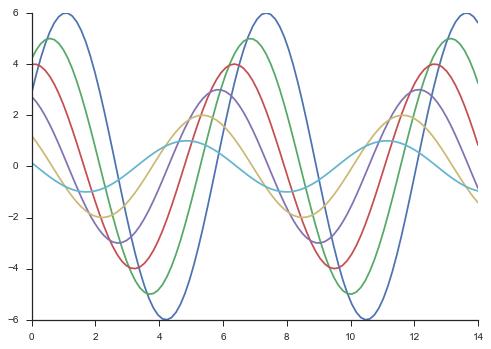
有时候我们会去掉box的上轴和右轴:
sinplot()
sns.despine()
当然你也可以:
sns.set_style(\'white\')
sinplot()
sns.despine(left=True, bottom=True)
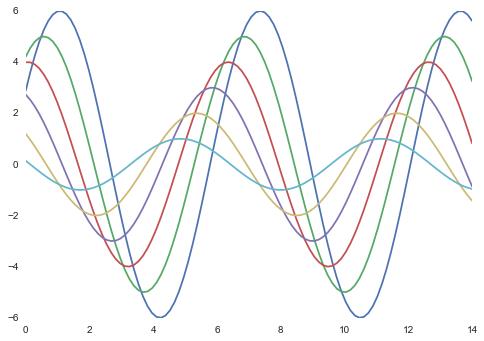
sns.despine()函数默认删除右轴和上轴。
f, ax = plt.subplots()
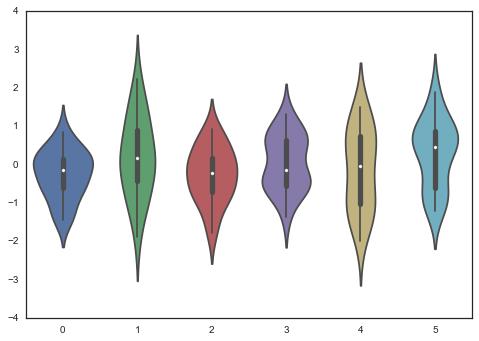
sns.violinplot(data=data)
<matplotlib.axes._subplots.AxesSubplot at 0x1fbc05bdc18>
f, ax = plt.subplots()
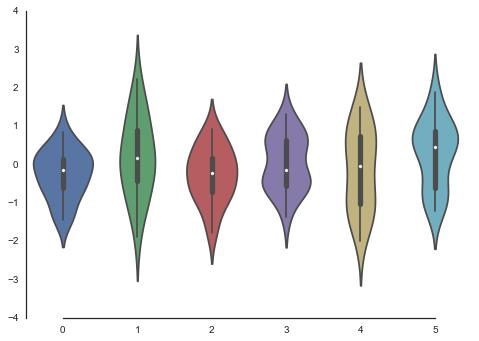
sns.violinplot(data=data)
sns.despine(trim=True)
Temporarily setting figure style
我们可以临时定义作图参数让子图拥有不同的样式:
with sns.axes_style(\'darkgrid\'):
    plt.subplot(211)
    sinplot()
plt.subplot(212)
sinplot(-1)
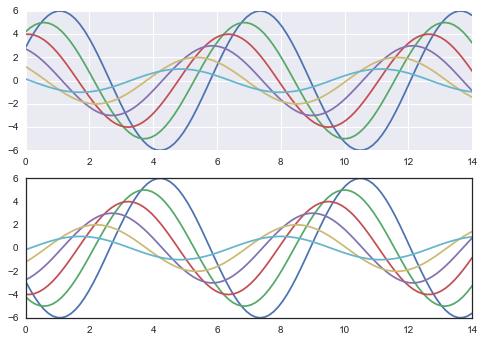
这样,我们就临时调用了\'darkgrid\'样式。
Overriding elements of the seaborn styles
我们可以看看Seaborn的默认样式参数:
sns.axes_style()
{\'axes.axisbelow\': True,
 \'axes.edgecolor\': \'.15\',
 \'axes.facecolor\': \'white\',
 \'axes.grid\': False,
 \'axes.labelcolor\': \'.15\',
 \'axes.linewidth\': 1.25,
 \'figure.facecolor\': \'white\',
 \'font.family\': [\'sans-serif\'],
 \'font.sans-serif\': [\'Arial\',
  \'Liberation Sans\',
  \'Bitstream Vera Sans\',
  \'sans-serif\'],
 \'grid.color\': \'.8\',
 \'grid.linestyle\': \'-\',
 \'image.cmap\': \'Greys\',
 \'legend.frameon\': False,
 \'legend.numpoints\': 1,
 \'legend.scatterpoints\': 1,
 \'lines.solid_capstyle\': \'round\',
 \'text.color\': \'.15\',
 \'xtick.color\': \'.15\',
 \'xtick.direction\': \'out\',
 \'xtick.major.size\': 0.0,
 \'xtick.minor.size\': 0.0,
 \'ytick.color\': \'.15\',
 \'ytick.direction\': \'out\',
 \'ytick.major.size\': 0.0,
 \'ytick.minor.size\': 0.0}
它是一个字典,我们可以自己定义值:
sinplot()
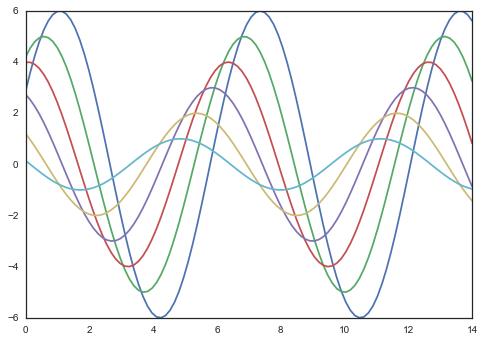
sns.set_style({\'axes.facecolor\':\'.9\'})
sinplot()

其他参数也可以修改。
Scaling plot elements
接下来是修改图的元素比例,包括线条大小,坐标大小等等。
sns.set()
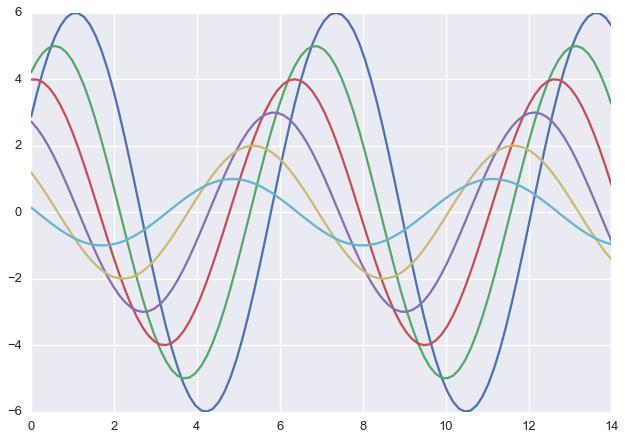
Seaborn预设了四种比例,根据大小依次为 paper, notebook, talk 和 poster。默认为 notebook。
sns.plotting_context()
{\'axes.labelsize\': 11.0,
 \'axes.titlesize\': 12.0,
 \'figure.figsize\': [8.0, 5.5],
 \'font.size\': 12.0,
 \'grid.linewidth\': 1.0,
 \'legend.fontsize\': 10.0,
 \'lines.linewidth\': 1.75,
 \'lines.markeredgewidth\': 0.0,
 \'lines.markersize\': 7.0,
 \'patch.linewidth\': 0.3,
 \'xtick.labelsize\': 10.0,
 \'xtick.major.pad\': 7.0,
 \'xtick.major.width\': 1.0,
 \'xtick.minor.width\': 0.5,
 \'ytick.labelsize\': 10.0,
 \'ytick.major.pad\': 7.0,
 \'ytick.major.width\': 1.0,
 \'ytick.minor.width\': 0.5}
可以看到默认的元素大小。
sinplot()
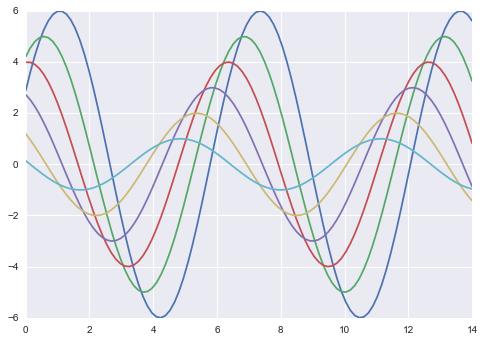
sns.set_context(\'talk\')
sinplot()
sns.set_context("poster")
sinplot()
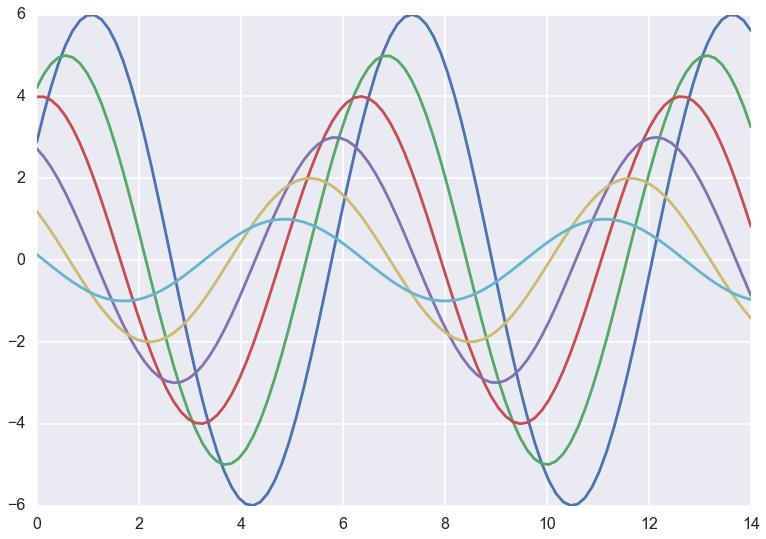
同样的,可以利用 sns.set_context()来设置sns.plotting_context()中的值。
zxzhu 2018/3/30
