机器学习二(线性回归和Logistic回归)
Posted 最爱我的肉肉
tags:
篇首语:本文由小常识网(cha138.com)小编为大家整理,主要介绍了机器学习二(线性回归和Logistic回归)相关的知识,希望对你有一定的参考价值。
 前言
前言
由于本部分内容讲解资源较多,本文不做过多叙述,重点放在实际问题的应用上。
一、线性回归
线性回归中的线性指的是对于参数的线性的,对于样本的特征不一定是线性的。
线性模型(矩阵形式):y=XA+e
其中:A为参数向量,y为向量,X为矩阵,e为噪声向量。
对于线性模型,通常采用最小二乘法作为其解法(可通过最大似然估计推得)。
最小二乘法是通过最小化误差的平方和寻找数据的最佳函数匹配。
最小二乘法的解法有很多种,通常有:
解析法即求通过函数的导数为0确定函数的极值点
矩阵法-——解析法的矩阵形式
![]()
梯度下降法:在求解损失函数的最小值时,可以通过梯度下降来一步步的迭代求解,得到最小化的损失函数和模型参数值。
常见的方式有三种,分别是:批量梯度下降法BGD、随机梯度下降法SGD、小批量梯度下降法MBGD。
其他优化算法,如牛顿法等。
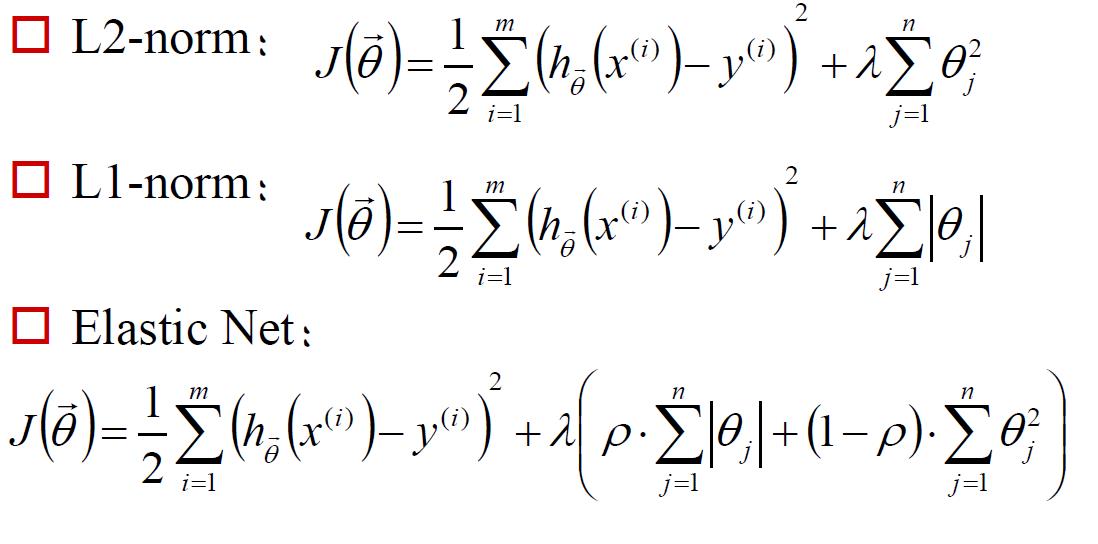
为避免过拟合,通常在线性回归模型中加入正则项,分为以下三类:
二、Logistic回归
sigmoid函数: y=1/(1+exp(-x))
模型:

假设 P(y=1|x;θ)=hθ(x)
最大似然估计方法(损失函数)

通过梯度下降法得到

softmax回归(多目标分类)

三、实践练习
数据集采用sklearn自带数据集 Boston ,由房屋的特征预测房屋的价格。
from sklearn.preprocessing import StandardScaler
from sklearn.model_selection import train_test_split
from sklearn.linear_model import LinearRegression
import numpy as np
from sklearn import datasets
import matplotlib.pyplot as plt
import matplotlib as mpl
from sklearn.linear_model import Lasso, Ridge
from sklearn.model_selection import GridSearchCV

dataset=datasets.load_boston()

X=dataset.data
Y=dataset.target

#X_norm=StandardScaler().fit_transform(X)
X_norm=X #是否标准化对值没有影响,这也是可以解释的
x_train, x_test, y_train, y_test = train_test_split(X_norm, Y, train_size=0.7, random_state=0)

model1 = LinearRegression()
model1.fit(x_train,y_train)
print(model1)
print(model1.coef_, model1.intercept_)

#model2 = Ridge()
model2=Lasso()
alpha_can = np.logspace(-3, 2, 10)
lasso_model = GridSearchCV(model2, param_grid={\'alpha\':alpha_can}, cv=5)
lasso_model.fit(x_train, y_train)
print(\'超参数:\\n\', lasso_model.best_params_)

order = y_test.argsort(axis=0)  #对测试样本排序,便于显示
y_test = y_test[order]
x_test = x_test[order, :]

y_hat1=model1.predict(x_test)
mse1 = np.average((y_hat1 - np.array(y_test)) ** 2)
print(\'MSE-LR = \', mse1)

y_hat2=lasso_model.predict(x_test)
mse2 = np.average((y_hat2 - np.array(y_test)) ** 2)
print(\'MSE-LASSO = \', mse2)


mpl.rcParams[\'font.sans-serif\'] = [u\'simHei\']
mpl.rcParams[\'axes.unicode_minus\'] = False
plt.figure(facecolor=\'w\',figsize=(15, 8))
plt.plot(y_test, \'r-\', lw=1, label=u\'真实值\')
plt.plot(y_hat1, \'g-\', lw=1, label=u\'线性回归估计值\')
plt.plot(y_hat2, \'b-\', lw=1, label=u\'Lasso估计值\')
plt.legend(loc=\'upper left\')
plt.title(u\'线性回归模型波士顿房价预测\', fontsize=18)
plt.xlabel(u\'样本编号\', fontsize=15)
plt.ylabel(u\'房屋价格\', fontsize=15)
plt.grid()
plt.show()
结果如下图:
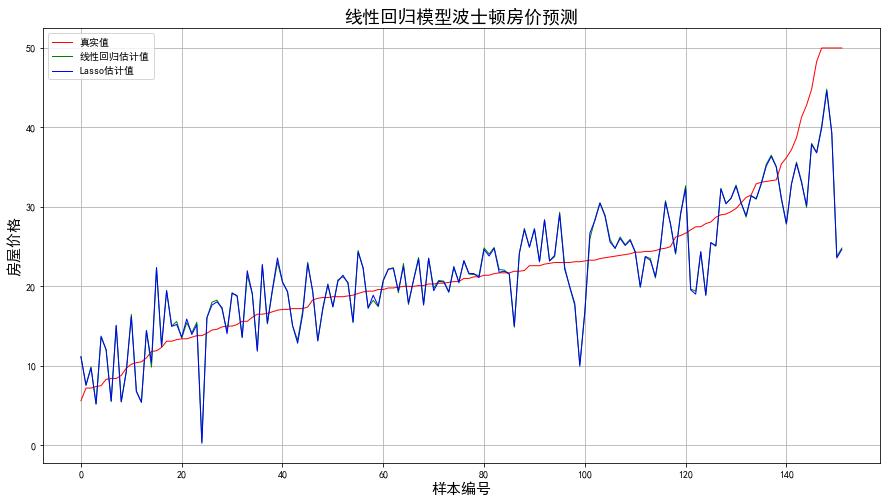
图1
图中显示,采用普通线性回归的结果和采用Lasso的结果基本一致,甚至在图上难以区分,如采用Ridge方法,结果也基本一致。
用多项式特征来拟合:
from sklearn.preprocessing import StandardScaler
from sklearn.model_selection import train_test_split
from sklearn.linear_model import LinearRegression
import numpy as np
from sklearn import datasets
import matplotlib.pyplot as plt
import matplotlib as mpl
from sklearn.linear_model import Lasso, Ridge
from sklearn.model_selection import GridSearchCV
from sklearn.preprocessing import PolynomialFeatures
from sklearn.pipeline import make_pipeline


dataset=datasets.load_boston()

X=dataset.data
Y=dataset.target


x_train, x_test, y_train, y_test = train_test_split(X, Y, train_size=0.7, random_state=0)
order = y_test.argsort(axis=0)  #对测试样本排序,便于显示
y_test = y_test[order]
x_test = x_test[order, :]
for degree in np.arange(1,5):
    model = make_pipeline(PolynomialFeatures(degree),Lasso(alpha=0.1))
    model.fit(x_train,y_train)
    y_hat=model.predict(x_test)
    mse = np.average((y_hat - np.array(y_test)) ** 2)
    print(\'当模型次数为:%d\'%degree)
    print(\'MSE = \', mse)
    mpl.rcParams[\'font.sans-serif\'] = [u\'simHei\']
    mpl.rcParams[\'axes.unicode_minus\'] = False
    plt.figure(facecolor=\'w\',figsize=(10, 5))
    plt.plot(y_test, \'r-\', lw=1, label=u\'真实值\')
    plt.plot(y_hat, \'g-\', lw=1, label=\'degree %d\' % degree)
    plt.legend(loc=\'upper left\')
    plt.title(u\'线性回归模型波士顿房价预测\', fontsize=18)
    plt.xlabel(u\'样本编号\', fontsize=15)
    plt.ylabel(u\'房屋价格\', fontsize=15)
    plt.grid()
plt.show()
结果:
当模型次数为:1
MSE =  28.8704970547
当模型次数为:2
MSE =  17.7654067367
当模型次数为:3
MSE =  22.899129217
当模型次数为:4
MSE =  29.5967408848
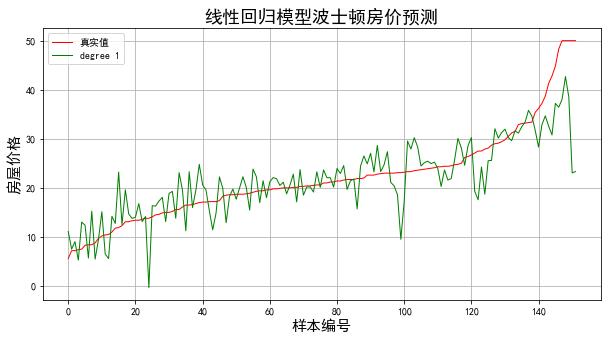
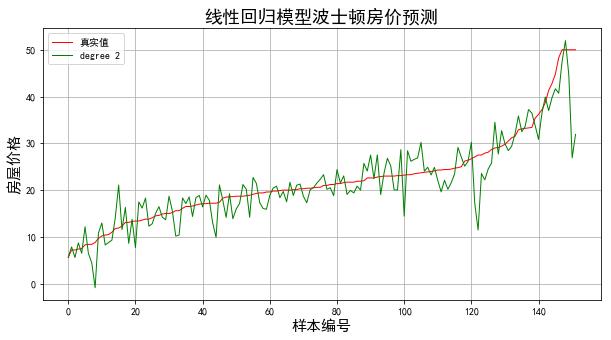
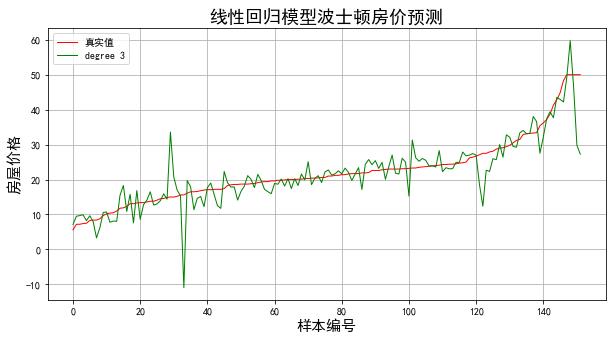
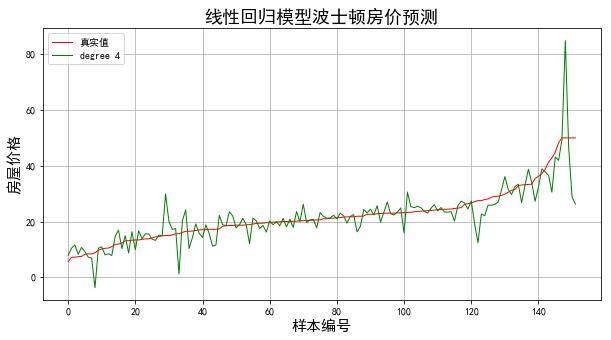
结果显示当多项式区二次时得到最好的拟合效果
以上是关于机器学习二(线性回归和Logistic回归)的主要内容,如果未能解决你的问题,请参考以下文章