Echart--单个柱形图
Posted LWJ_jay
tags:
篇首语:本文由小常识网(cha138.com)小编为大家整理,主要介绍了Echart--单个柱形图相关的知识,希望对你有一定的参考价值。
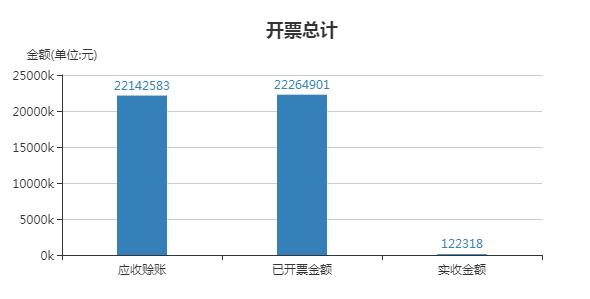
效果图:
dom:
<div class="chartAll" ref="chartAll"></div>
js:
let chartAll = this.$refs.chartAll//获取DOM
this.getChartAll = echarts.init(chartAll)
this.getChartAll.setOption(this.optionAll, true)
设置数据:
optionAll: {
          title: {
            text: \'开票总计\',
            left: \'center\'
          },
          tooltip: {
            trigger: \'axis\',
            axisPointer: {
              type: \'cross\',
              crossStyle: {
                color: \'#999\'
              }
            }
          },
          legend: {
            // bottom: 10,
            // data: [\'金额\']
          },
          xAxis: [
            {
              type: \'category\',
              data: [\'应收赊账\', \'已开票金额\', \'实收金额\'],
              axisPointer: {
                type: \'shadow\'
              }
            }
          ],
          yAxis: [
            {
              type: \'value\',
              name: \'金额(单位:元)\',
              // min: 0,
              // max: 500,
              // interval: 100,
              axisLabel: {
                formatter: function(value) {
                  let mun = value / 1000
                  return mun + \'k\'
                }
              }
            }
          ],
          series: [
            {
              barMaxWidth: \'50\',
              itemStyle: {normal: {color: \'#3580B8\', label: {show: true, position: \'top\'}}},
              name: \'金额\',
              type: \'bar\',
              data: []//显示的数据
            }
          ]
        }
以上是关于Echart--单个柱形图的主要内容,如果未能解决你的问题,请参考以下文章