Getting the pixel coordinates of text or ticks in matplotlib
Posted 蠢材少年
tags:
篇首语:本文由小常识网(cha138.com)小编为大家整理,主要介绍了Getting the pixel coordinates of text or ticks in matplotlib相关的知识,希望对你有一定的参考价值。
The exact pixel coordinates of title, labels, legends or ticks are important information for the training data of deep learning.
import numpy as np
import matplotlib.pyplot as plt

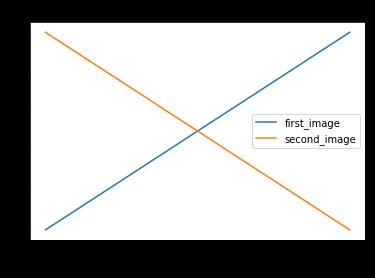
plt.plot([1,2],label="first_image")
plt.plot([2,1],label="second_image")
leg = plt.legend()

tit = plt.title("sss")
xla = plt.xlabel("xxx")

plt.gcf().canvas.draw()
ticks = [t for t in plt.gca().get_xticklabels()]

print(tit.get_text(),str(tit.get_window_extent()))    # return the context and pixel coordinates of \'tit\'
print(np.array(tit.get_window_extent()))
print(xla.get_text(),str(xla.get_window_extent()))

for i, t in enumerate(ticks):
    print ("Label "+str(i)+", data: "+t.get_text()+str(t.get_window_extent()))

print ("Legend location: "+str(leg.get_window_extent()))
for i, l in enumerate(leg.texts):
    print ("Label "+str(i)+", data: "+l.get_text()+str(l.get_window_extent()))
    pass
#plt.savefig("test.png")
plt.show()
sss Bbox(x0=211.8375, y0=256.44, x1=230.9625, y1=269.44)
[[ 211.8375  256.44  ]
 [ 230.9625  269.44  ]]
xxx Bbox(x0=212.5875, y0=5.0, x1=230.2125, y1=15.0)
Label 0, data: Bbox(x0=69.21818181818182, y0=29.0, x1=69.21818181818182, y1=29.0)
Label 1, data: 0.0Bbox(x0=61.21818181818182, y0=19.0, x1=77.21818181818182, y1=29.0)
Label 2, data: 0.2Bbox(x0=122.0909090909091, y0=19.0, x1=138.0909090909091, y1=29.0)
Label 3, data: 0.4Bbox(x0=182.9636363636364, y0=19.0, x1=198.9636363636364, y1=29.0)
Label 4, data: 0.6Bbox(x0=243.83636363636367, y0=19.0, x1=259.83636363636367, y1=29.0)
Label 5, data: 0.8Bbox(x0=304.70909090909095, y0=19.0, x1=320.70909090909095, y1=29.0)
Label 6, data: 1.0Bbox(x0=365.5818181818182, y0=19.0, x1=381.5818181818182, y1=29.0)
Label 7, data: Bbox(x0=69.21818181818182, y0=29.0, x1=69.21818181818182, y1=29.0)
Legend location: Bbox(x0=276.05, y0=127.31375, x1=383.8, y1=162.12625)
Label 0, data: first_imageBbox(x0=308.05, y0=147.22, x1=363.925, y1=158.12625)
Label 1, data: second_imageBbox(x0=308.05, y0=131.31375, x1=379.8, y1=142.22)

reference:
1. https://matplotlib.org/api/text_api.html#matplotlib.text.Annotation.get_window_extent
2. https://matplotlib.org/api/transformations.html#matplotlib.transforms.Bbox
以上是关于Getting the pixel coordinates of text or ticks in matplotlib的主要内容,如果未能解决你的问题,请参考以下文章