参考机器学习实战第二章K邻近算法的数据分析一小节,稍微修改了一下条件,准备拿去给蓝盆友做提醒。
 1 #!/usr/bin/env python
 2 # -*- coding: utf-8 -*-
 3
 4 import sys
 5 reload(sys)
 6 sys.setdefaultencoding(‘utf8‘)
 7 from numpy import *
 8 from pylab import mpl
 9 import matplotlib.pyplot as plt
10
11 mpl.rcParams[‘font.sans-serif‘] = [‘SimHei‘]  #  指定默认字体
12 n = 1000 #number of points to create
13 xcord1 = []; ycord1 = []
14 xcord2 = []; ycord2 = []
15 xcord3 = []; ycord3 = []
16 markers =[]
17 colors =[]
18 fw = open(‘testSet.txt‘,‘w‘)
19 for i in range(n):
20     [r0,r1] = random.standard_normal(2)
21     myClass = random.uniform(0,1)
22     if (myClass <= 0.16):
23         #Flyer = random.uniform(22000, 60000)
24         fFlyer = random.randint(0, 2)
25         tats = 3 + 1.6 * r1
26         markers.append(20)
27         colors.append(2.1)
28         classLabel = 1 #‘didntLike‘
29         xcord1.append(fFlyer); ycord1.append(tats)
30     elif ((myClass > 0.16) and (myClass <= 0.33)):
31         #fFlyer = 6000*r0 + 70000
32         fFlyer = random.randint(3, 6)
33         tats = 10 + 3*r1 + 2*r0
34         markers.append(20)
35         colors.append(1.1)
36         classLabel = 1 #‘didntLike‘
37         if (tats < 0): tats =0
38         if (fFlyer < 0): fFlyer =0
39         xcord1.append(fFlyer); ycord1.append(tats)
40     elif ((myClass > 0.33) and (myClass <= 0.66)):
41         #fFlyer = 5000*r0 + 10000
42         fFlyer = random.randint(7, 12)
43         tats = 3 + 2.8*r1
44         markers.append(30)
45         colors.append(1.1)
46         classLabel = 2 #‘smallDoses‘
47         if (tats < 0): tats =0
48         if (fFlyer < 0): fFlyer =0
49         xcord2.append(fFlyer); ycord2.append(tats)
50     else:
51
52         fFlyer = random.randint(13, 17)
53         tats = 10 + 2.0*r1
54         markers.append(50)
55         colors.append(0.1)
56         classLabel = 3 #‘largeDoses‘
57         if (tats < 0): tats =0
58         if (fFlyer < 0): fFlyer =0
59         xcord3.append(fFlyer); ycord3.append(tats)
60
61 fw.close()
62 fig = plt.figure()
63 ax = fig.add_subplot(111)
64 type1 = ax.scatter(xcord1, ycord1, s=20, c=‘red‘)
65 type2 = ax.scatter(xcord2, ycord2, s=30, c=‘green‘)
66 type3 = ax.scatter(xcord3, ycord3, s=50, c=‘blue‘)
67 ax.legend((type1, type2, type3),( ‘一点都不喜欢‘,‘就喜欢一点‘,‘没有一点不喜欢‘),)
68 ax.axis([-1,18,-2,25])
69 plt.xlabel(‘每月刮胡子的次数‘)
70 plt.ylabel(‘玩视频游戏所消耗时间百分比‘)
71 plt.show()
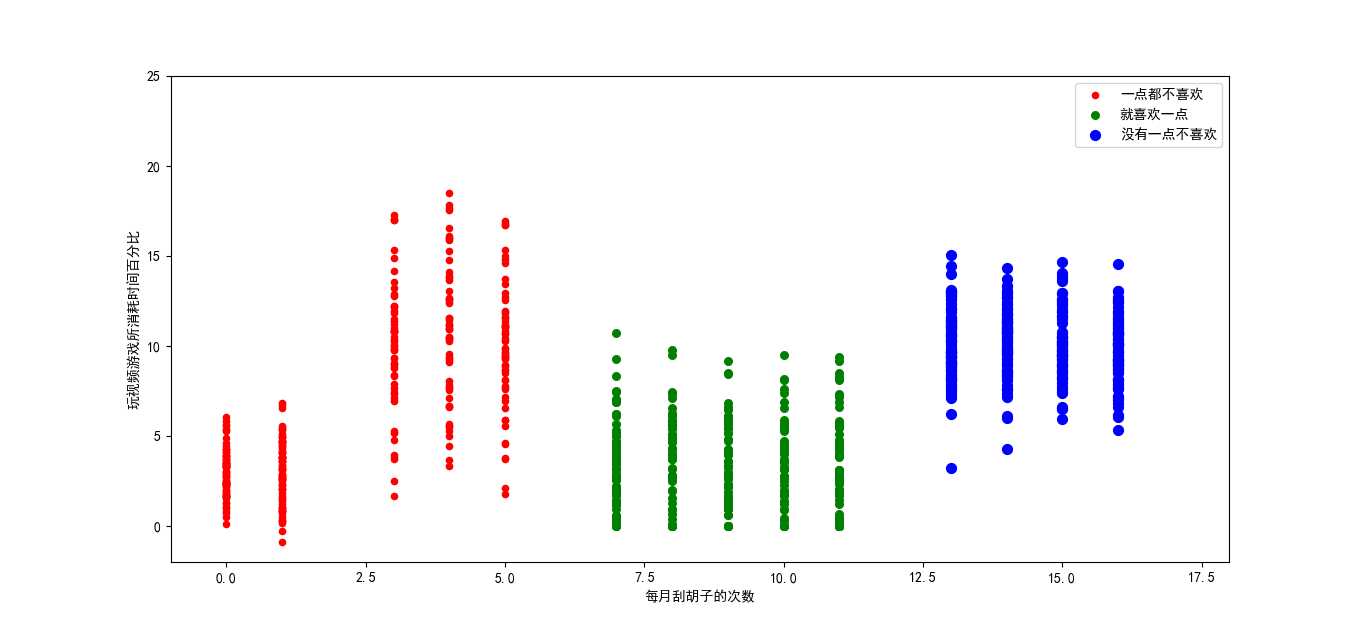
可以看出,玩游戏少,看视频率低,并且爱干净的男生更受欢迎哈。