matplotlib笔记(subplot)
Posted imageSet
tags:
篇首语:本文由小常识网(cha138.com)小编为大家整理,主要介绍了matplotlib笔记(subplot)相关的知识,希望对你有一定的参考价值。
import matplotlib.plot as plt
fig = plt.figure()
ax1 = fig.add_subplot(4,3,1)
ax2 = fig.add_subplot(4,3,6)
plt.show()
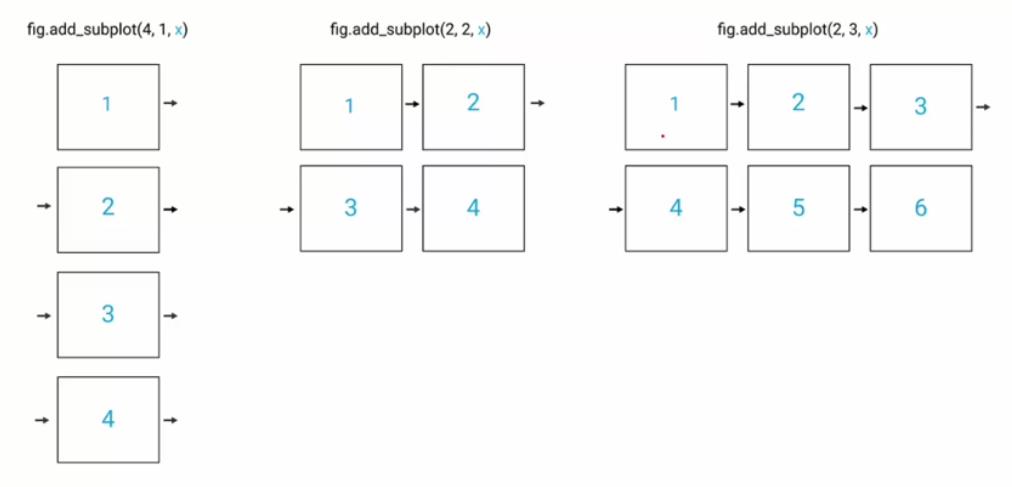
建立一个包含4行3列个子图的figure,add_subplot()可以指定放置位置,具体关系如下:

fig = plt.figure(figsize=(10,6))
figure()中可包含参数figsize=(10,6),10表示figure对象的横向长度,6表示纵向长度。
ax1.plot(x_list,y_list,c=color)#数据与线条颜色
ax1.legend(loc=\'best\')#添加图例
以上是关于matplotlib笔记(subplot)的主要内容,如果未能解决你的问题,请参考以下文章