elk的诸多beats
参考: https://www.elastic.co/guide/en/beats/libbeat/current/community-beats.html
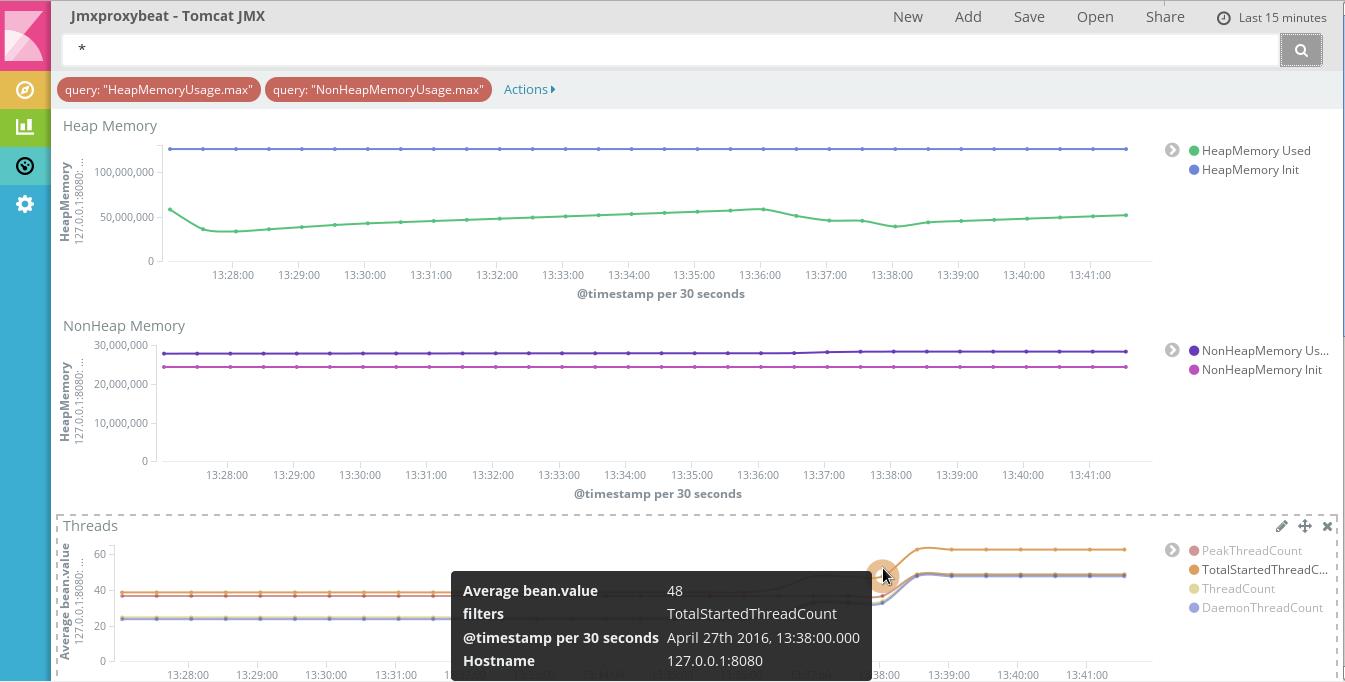
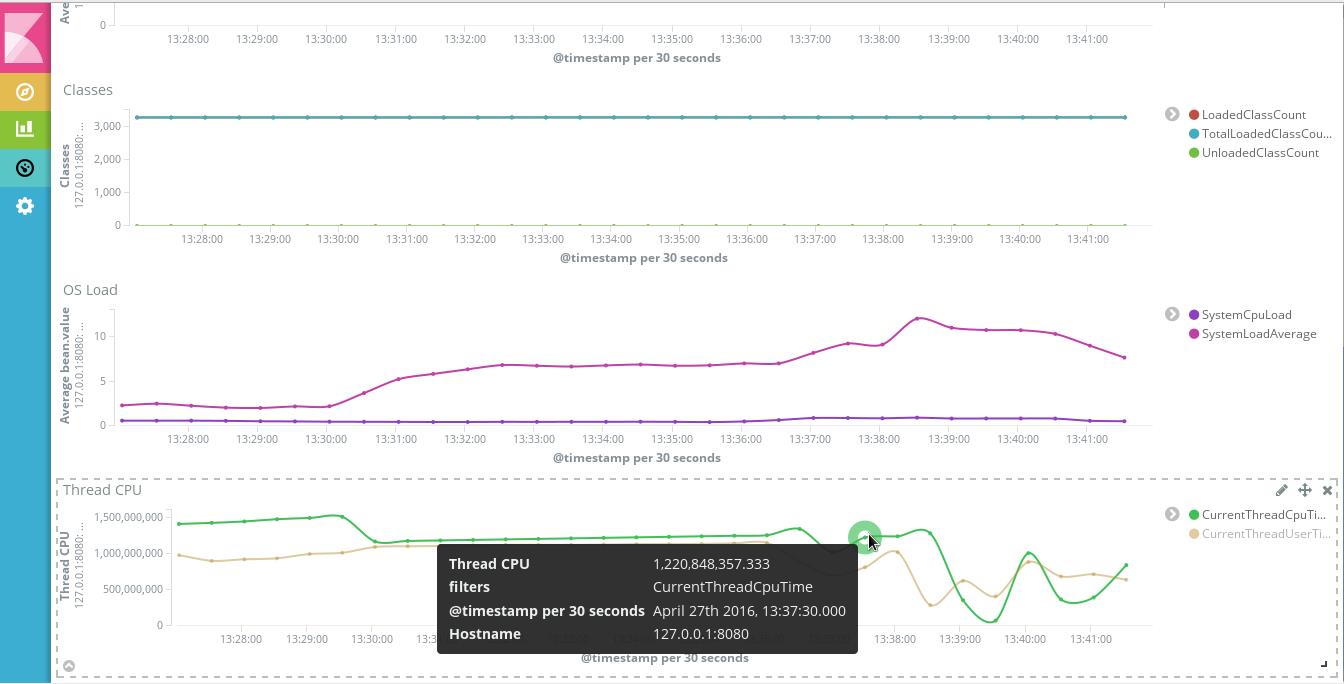
jmxproxybeat
参考: https://github.com/radoondas/jmxproxybeat
Metricbeat
正确姿势启动metricbeat
metricbeat.modules:
- module: system
  metricsets:
    - cpu
    - filesystem
    - memory
    - network
    - process
  enabled: true
  period: 10s
  processes: [\'.*\']
  cpu_ticks: false

output.elasticsearch:
    hosts: ["http://192.168.x.x:9200"]

setup.template.name: "metricbeat"
setup.template.fields: "fields.yml"
setup.template.overwrite: true
setup.template.settings:
  index.number_of_shards: 1
  index.number_of_replicas: 1

setup.kibana.host: "192.168.x.x:5601"
setup.dashboards.enabled: true
./metricbeat -e -c metricbeat.yml -d "publish"

它有这些指标模块
This section contains detailed information about the metric collecting modules contained in Metricbeat. Each module contains one or multiple metricsets. More details about each module can be found under the links below.

Aerospike
Apache
Ceph
Couchbase
Docker
Dropwizard
Elasticsearch
Golang
HAProxy
HTTP
Jolokia
Kafka
Kibana
Kubernetes
Memcached
MongoDB
mysql
nginx
php-FPM
PostgreSQL
Prometheus
RabbitMQ
Redis
System
vSphere
Windows
ZooKeeper
amazonbeat

Reads data from a specified Amazon product.

apachebeat

Reads status from Apache HTTPD server-status.

apexbeat

Extracts configurable contextual data and metrics from Java applications via the APEX toolkit.

burrowbeat

Monitors Kafka consumer lag using Burrow.

cassandrabeat

Uses Cassandra’s nodetool cfstats utility to monitor Cassandra database nodes and lag.

cloudflarebeat

Indexes log entries from the Cloudflare Enterprise Log Share API.

cloudfrontbeat

Reads log events from Amazon Web Services CloudFront.

cloudtrailbeat

Reads events from Amazon Web Services\' CloudTrail.

cloudwatchmetricbeat

A beat for Amazon Web Services\' CloudWatch Metrics.

cloudwatchlogsbeat

Reads log events from Amazon Web Services\' CloudWatch Logs.

collectbeat

Adds discovery on top of Filebeat and Metricbeat in environments like Kubernetes.

connbeat

Exposes metadata about TCP connections.

consulbeat

Reads services health checks from consul and pushes them to Elastic.

dockbeat

Reads Docker container statistics and indexes them in Elasticsearch.

elasticbeat

Reads status from an Elasticsearch cluster and indexes them in Elasticsearch.

etcdbeat

Reads stats from the Etcd v2 API and indexes them into Elasticsearch.

execbeat

Periodically executes shell commands and sends the standard output and standard error to Logstash or Elasticsearch.

factbeat

Collects facts from Facter.

flowbeat

Collects, parses, and indexes sflow samples.

gabeat

Collects data from Google Analytics Realtime API.

githubbeat

Easily monitors GitHub repository activity.

gpfsbeat

Collects GPFS metric and quota information.

hsbeat

Reads all performance counters in Java HotSpot VM.

httpbeat

Polls multiple HTTP(S) endpoints and sends the data to Logstash or Elasticsearch. Supports all HTTP methods and proxies.

hwsensorsbeat

Reads sensors information from OpenBSD.

icingabeat

Icingabeat ships events and states from Icinga 2 to Elasticsearch or Logstash.

iobeat

Reads IO stats from /proc/diskstats on Linux.

jmxproxybeat

Reads Tomcat JMX metrics exposed over JMX Proxy Servlet to HTTP.

journalbeat

Used for log shipping from systemd/journald based Linux systems.

kafkabeat

Reads data from Kafka topics.

krakenbeat

Collect information on each transaction on the Kraken crypto platform.

lmsensorsbeat

Collects data from lm-sensors (such as CPU temperatures, fan speeds, and voltages from i2c and smbus).

logstashbeat

Collects data from Logstash monitoring API (v5 onwards) and indexes them in Elasticsearch.

mcqbeat

Reads the status of queues from memcacheq.

mongobeat

Monitors MongoDB instances and can be configured to send multiple document types to Elasticsearch.

mqttbeat

Add messages from mqtt topics to Elasticsearch.

mysqlbeat

Run any query on MySQL and send results to Elasticsearch.

nagioscheckbeat

For Nagios checks and performance data.

nginxbeat

Reads status from Nginx.

nginxupstreambeat

Reads upstream status from nginx upstream module.

nvidiagpubeat

Uses nvidia-smi to grab metrics of NVIDIA GPUs.

openconfigbeat

Streams data from OpenConfig-enabled network devices

packagebeat

Collects information about system packages from package managers.

phpfpmbeat

Reads status from PHP-FPM.

pingbeat

Sends ICMP pings to a list of targets and stores the round trip time (RTT) in Elasticsearch.

prombeat

Indexes Prometheus metrics.

prometheusbeat

Send Prometheus metrics to Elasticsearch via the remote write feature.

protologbeat

Accepts structured and unstructured logs via UDP or TCP. Can also be used to receive syslog messages or GELF formatted messages. (To be used as a successor to udplogbeat)

redditbeat

Collects new Reddit Submissions of one or multiple Subreddits.

redisbeat

Used for Redis monitoring.

retsbeat

Collects counts of RETS resource/class records from Multiple Listing Service (MLS) servers.

rsbeat

Ships redis slow logs to elasticsearch and anlyze by Kibana.

saltbeat

Reads events from salt master event bus.

springbeat

Collects health and metrics data from Spring Boot applications running with the actuator module.

twitterbeat

Reads tweets for specified screen names.

udpbeat

Ships structured logs via UDP.

udplogbeat

Accept events via local UDP socket (in plain-text or JSON with ability to enforce schemas). Can also be used for applications only supporting syslog logging.

unifiedbeat

Reads records from Unified2 binary files generated by network intrusion detection software and indexes the records in Elasticsearch.

uwsgibeat

Reads stats from uWSGI.

varnishlogbeat

Reads log data from a Varnish instance and ships it to Elasticsearch.

varnishstatbeat

Reads stats data from a Varnish instance and ships it to Elasticsearch.

wmibeat

Uses WMI to grab your favorite, configurable Windows metrics.
kibana插件
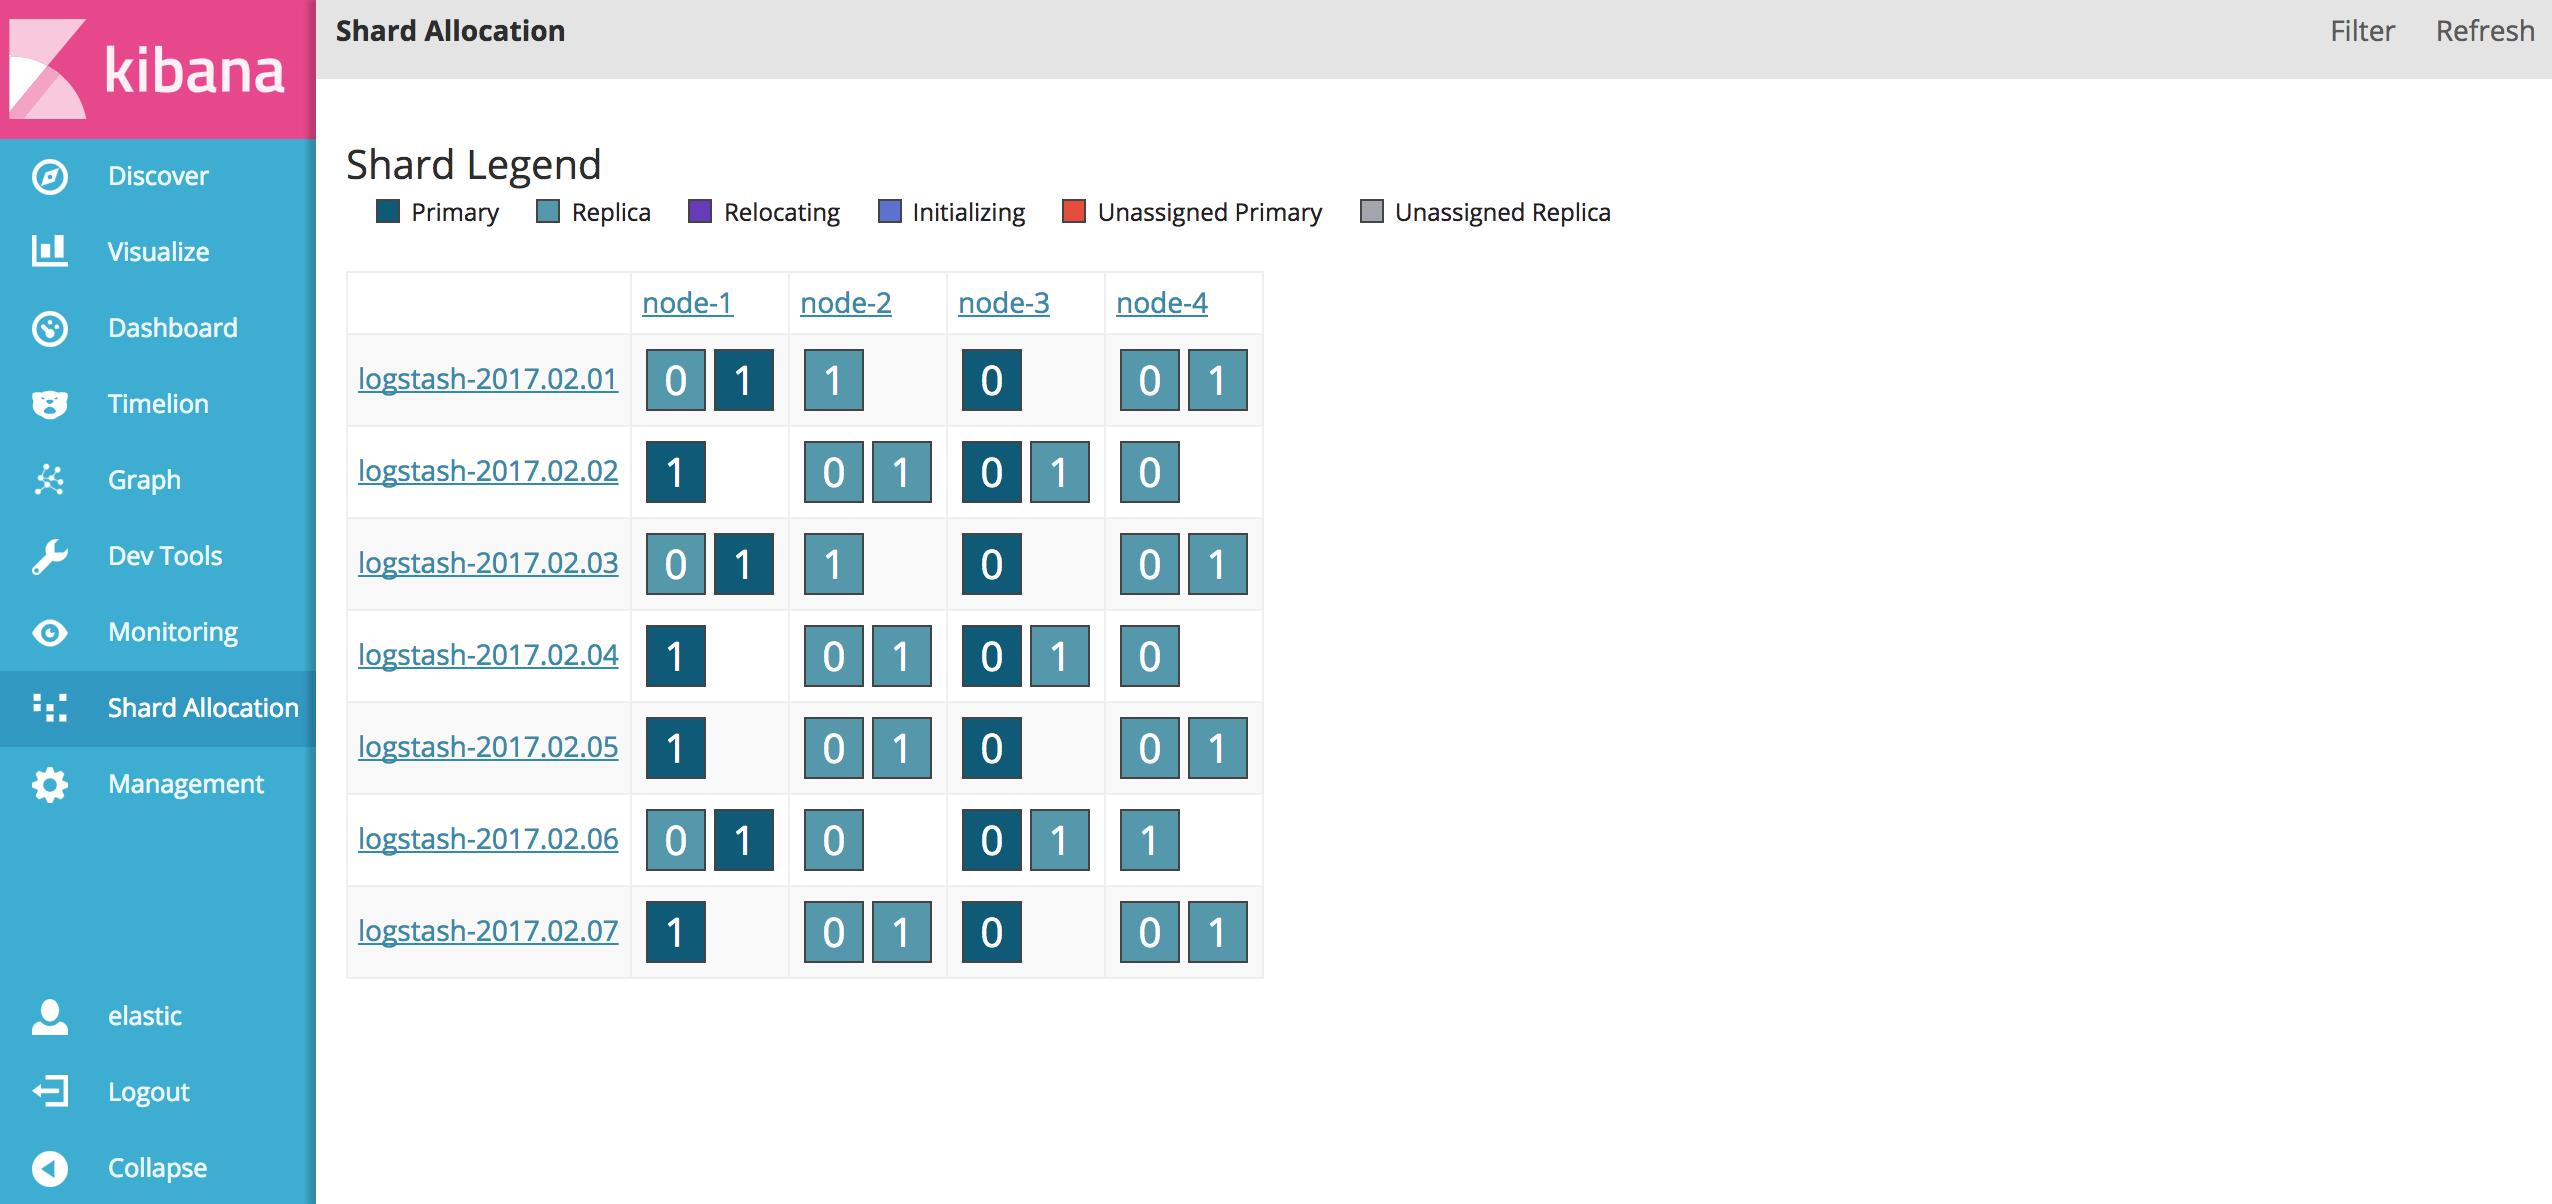
kibana_shard_allocation
参考: https://github.com/asileon/kibana_shard_allocation
mathlion
Mathlion is an advanced math plugin for Kibana\'s Timelion
参考: https://github.com/fermiumlabs/mathlion
.es(*).math("a=source")  //the variable "a" now contains the elasticsearch query.
.nop().math("a")  //this row now equals the former elasticsearch query

.es(*).math("source") //return the .es(*) query
.es(*).math("source+5") // add 5 to the .es(*) query

.nop().math("a=a+2 ; a=a+3 ")  //adds 5 to a
.nop().math("a=a+2 ; a=a+3 ; a ")  //adds 5 to a and displays a+5

.es(*).math("a=source")  //this query is invisible and does not generate an axis
.es(*).math("a=source; a")  //this query does

.nop.math("sqrt(3^2 + 4^2)") //returns 5

//Calculate power comsumption based on measured current and stimated voltage (in Europe)
.nop().math("electricPower(v,i)=(v*i)")
.es(metric=avg:current).math(machineCurrent=source)
.nop().math("elascPower(230,machineCurrent)")

//plot the horizontal statistical mean and variance
.es(*).math("me=mean(source); va=var(source)")
.value(1).math(me*source)
.value(1).math("(me+sqrt(va))*source")
.value(1).math("(me-sqrt(va))*source")