对线性回归,logistic回归的认识
Posted 迈克老狼2012
tags:
篇首语:本文由小常识网(cha138.com)小编为大家整理,主要介绍了对线性回归,logistic回归的认识相关的知识,希望对你有一定的参考价值。
一般来说,回归不用在分类问题上,因为回归是连续型模型,而且受噪声影响比较大。如果非要使用回归算法,可以使用logistic回归。
logistic回归本质上是线性回归,只是在特征到结果的映射中多加入了一层函数映射,即先把特征线性求和,然后使用函数g(z)作为假设函数来预测,g(z)可以将连续值映射到0和1上。
logistic回归的假设函数如下,线性回归假设函数只是\\(\\theta^Tx\\)。
\\[h_\\theta(x)=g(\\theta^Tx)=\\frac{1}{1+e^{-\\theta^Tx}}\\]
\\[g(z)=\\frac{1}{1+e^{-z}}\\]
\\[g’(z)=\\frac{d}{dz}\\frac{1}{1+e^{-z}}=\\frac{1}{(1+e^{-z})^2}e^{-z}=\\frac{1}{(1+e^{-z})}\\bigg(1-\\frac{1}{(1+e^{-z})}\\bigg)=g(z)(1-g(z))\\]
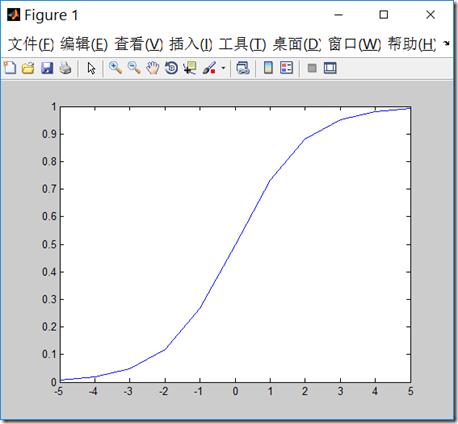
g函数一般称作logistic函数,图像如下,z很小时,g(z)趋于0,z很大时,g(z)趋于1,z=0时,g(z)=0.5
x = linspace(-5, 5, 11)
plot(x,1./(1+exp(-x)))
logistic回归用来分类0/1问题,也就是预测结果属于0或者1的二值分类问题。这里假设了二值满足伯努利分布,也就是
\\[P(y=1|x;\\theta)=h_\\theta(x)\\]
\\[P(y=0|x;\\theta)=1-h_\\theta(x)\\]
可以简写成:
\\[p(y|x;\\theta)=(h_\\theta(x))^y(1-h_\\theta(x))^{1-y}\\]
参数的似然性:
\\[L(\\theta)=p(\\vec{y}|X;\\theta) = \\prod_{i=1}^{m}p(y^{(i)}|x^{(i)};\\theta)= \\prod_{i=1}^{m}(h_\\theta(x^{(i)}))^{y^{(i)}} (1-h_\\theta(x^{(i)}))^{1-y^{(i)}} \\]
求对数似然性:
\\[l(\\theta)=logL(\\theta)=\\sum\\limits_{i=1}^{m}(y^{(i)}logh_{\\theta}(x^{(i)})+(1-y^{(i)})log(1-h_{\\theta}(x^{(i)}))\\]
为了使似然性最大化,类似于线性回归使用梯度下降的方法,求对数似然性对\\(\\theta\\)的偏导,即:
\\[\\theta:=\\theta+\\alpha\\bigtriangledown_{\\theta}l(\\theta)\\]
因为求最大值,此时为梯度上升。
偏导数展开:
\\begin{align*} \\frac{\\partial}{\\partial\\theta_j}l(\\theta) &=\\bigg(y\\frac{1}{g(\\theta^Tx)}-(1-y)\\frac{1}{1-g(\\theta^Tx)}\\bigg)\\frac{\\partial}{\\partial\\theta_j}g(\\theta^Tx) \\\\
&=\\bigg(y\\frac{1}{g(\\theta^Tx)}-(1-y)\\frac{1}{1-g(\\theta^Tx)}\\bigg)g(\\theta^Tx)(1-g(\\theta^Tx))\\frac{\\partial}{\\partial\\theta_j}\\theta^Tx \\\\ &=\\big(y(1-g(\\theta^Tx)-(1-y)g(\\theta^Tx)\\big)x_j \\\\ &=(y-h_\\theta(x))x_j
\\end{align*}
则:
一个采样中计算\\(\\theta_j\\),随机梯度上升法
\\[\\theta_j:=\\theta_j+\\alpha(y^{(i)}-h_{\\theta}(x^{(i)}))x_j^{(i)}\\]
从所有采样中计算\\(\\theta_j\\),批量梯度上升法,这和我们前面推导的线性回归的梯度下降法公式是一致的。
\\[\\theta_j:=\\theta_j+\\alpha\\frac{1}{m}\\sum\\limits_{i=1}^{m}(y^{(i)}-h_{\\theta}(x^{(i)}))x_j^{(i)}\\]
梯度上升法和梯度下降法是等价的,比如在上面公式推导中,可以令\\(J(\\theta)=-l(\\theta)\\),求导数后,得到梯度下降法的迭代公式
\\[\\theta_j:=\\theta_j-\\alpha(h_{\\theta}(x^{(i)})-y^{(i)})x_j^{(i)}\\]
数据下载:
| ex4x.dat 第一列 | ex4x.dat 第二列 | ex4y.dat |
| 成绩1分数 | 成绩2分数 | 是否被录取,1是,0否 |
和前面实现线性回归一样(http://www.cnblogs.com/mikewolf2002/p/7634571.html),我们也可以用矩阵来实现批量梯度上升法(或下降法)的迭代求解。
\\[\\theta_j:=\\theta_j+\\alpha\\frac{1}{m}\\sum\\limits_{i=1}^{m}(y^{(i)}-h_{\\theta}(x^{(i)}))x_j^{(i)}\\]
对上面的公式,可以转化为矩阵,在matlib中,大致如下:\\(A=\\theta^Tx\\),其中,\\(x\\)是\\(m\\times (n+1)\\)维矩阵,\\(m\\)是样本数,\\(n\\)是特征数目,\\(x\\)中我们额外增加了1列,以便和\\(\\theta_0\\)对应。
\\(\\theta\\)是\\((n+1)\\times 1\\)矩阵,则\\(A\\)为是\\(m\\times 1\\)矩阵,然后\\(x\\)的转置再点乘以\\((g(A)-y)\\)得到梯度,最后乘以学习率\\(\\alpha\\times\\frac{1}{m}\\),其中g表示logistic函数。
A = x*theta;
grad = (1/m).* x\' * (g(A) - y);%求出梯度
theta = theta - alpha .* grad;%更新theta
代码:

clear all; close all; clc

x = load(\'ex4x.dat\');
y = load(\'ex4y.dat\');

[m, n] = size(x);
x = [ones(m, 1), x]; % 输入特征增加一列,x0=1

figure
pos = find(y); neg = find(y == 0);%find是找到的一个向量,其结果是find函数括号值为真时的值的行号
plot(x(pos, 2), x(pos,3), \'+\')
hold on
plot(x(neg, 2), x(neg, 3), \'o\')
hold on
xlabel(\'Exam 1 score\')
ylabel(\'Exam 2 score\')

theta = zeros(n+1, 1);%初始化theta值
g = inline(\'1.0 ./ (1.0 + exp(-z))\'); %定义logistic函数
MAX_ITR = 605000;%最大迭代数目
alpha = 0.1; %学习率
i = 0;
while(i<MAX_ITR)
   A = x*theta;
   grad = (1/m).* x\' * (g(A) - y);%求出梯度
   theta = theta - alpha .* grad;%更新theta
   if(i>2)
       delta = old_theta-theta;
       delta_v = delta.*delta;
       if(delta_v<0.0000001)%如果两次theta的内积变化很小,退出迭代
           break;
       end
       %delta_v
   end
   old_theta = theta;
   %theta
   i=i+1;
end
i
old_theta
theta
%theta=[-16.378;0.1483;0.1589];
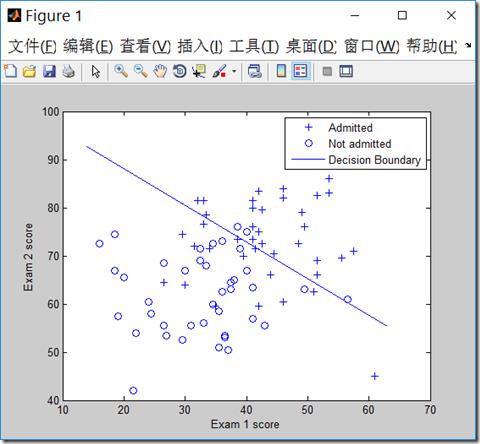
prob =  g([1, 80, 80]*theta)
plot_x = [min(x(:,2))-2,  max(x(:,2))+2];
% 画出概率g(theta^Tx)=0.5的分界线,解出对应的theta值
plot_y = (-1./theta(3)).*(theta(2).*plot_x +theta(1));
plot(plot_x, plot_y)
legend(\'Admitted\', \'Not admitted\', \'Decision Boundary\')
我们也可以用牛顿迭代法实现logistica回归。牛顿迭代法原理见:http://www.cnblogs.com/mikewolf2002/p/7642989.html
我们要求\\(l’(\\theta)=0\\)时候的偏导数,换成牛顿迭代公式则为:
\\[\\theta := \\theta - \\frac{l\'(\\theta)}{l\'\'(\\theta)}\\]
\\[\\theta := \\theta - H^{-1}\\bigtriangledown_{\\theta}l(\\theta)\\]
其中\\(\\bigtriangledown_{\\theta}l(\\theta)\\)为目标函数的梯度。\\(H\\)为Hessian矩阵,规模是\\(n\\times n\\),\\(n\\)是特征的数量,它的每个元素表示一个二阶导数。
上述公式的意义就是,用一个一阶导数的向量乘以一个二阶导数矩阵的逆。优点:若特征数和样本数合理,牛顿方法的迭代次数比梯度上升要少得多。缺点:每次迭代都要重新计算Hessian矩阵,如果特征很多,则H矩阵计算代价很大。
\\[H_{ij}=\\frac{\\partial^2l(\\theta)}{\\partial\\theta_i\\partial\\theta_j}\\]
\\[H=X^T\\begin{bmatrix}
g(\\mathbf{x}_1)\\cdot [1-g(\\mathbf{x}_1)]&0&\\cdots&0 \\\\
0&g(\\mathbf{x}_2)\\cdot [1-g(\\mathbf{x}_2)]&\\cdots&0 \\\\
\\vdots & \\vdots & \\ddots & \\vdots\\\\
0&0&\\cdots&g(\\mathbf{x}_m)\\cdot [1-g(\\mathbf{x}_m)] \\\\
\\end{bmatrix}X\\]
推导看这儿:牛顿法解机器学习中的Logistic回归
代码:

clear all; close all; clc

x = load(\'ex4x.dat\');
y = load(\'ex4y.dat\');

[m, n] = size(x);
x = [ones(m, 1), x]; % 输入特征增加一列,x0=1

figure
pos = find(y); neg = find(y == 0);%find是找到的一个向量,其结果是find函数括号值为真时的值的行号
plot(x(pos, 2), x(pos,3), \'+\')
hold on
plot(x(neg, 2), x(neg, 3), \'o\')
hold on
xlabel(\'Exam 1 score\')
ylabel(\'Exam 2 score\')

theta = zeros(n+1, 1);%初始化theta值
g = inline(\'1.0 ./ (1.0 + exp(-z))\'); %定义logistic函数

% Newton\'s method
MAX_ITR = 7;
J = zeros(MAX_ITR, 1);

for i = 1:MAX_ITR
    % Calculate the hypothesis function
    z = x * theta;
    h = g(z);%转换成logistic函数

    % Calculate gradient and hessian.
    % The formulas below are equivalent to the summation formulas
    % given in the lecture videos.
    grad = (1/m).*x\' * (h-y);%梯度的矢量表示法
    %diag(h),返回向量h为对角线元素的方阵
    H = (1/m).*x\' * diag(h) * diag(1-h) * x;%hessian矩阵的矢量表示法

    % Calculate J (for testing convergence)
    J(i) =(1/m)*sum(-y.*log(h) - (1-y).*log(1-h));%损失函数的矢量表示法

    theta = theta - H\\grad;%H\\逆矩阵
end
% Display theta
theta

% Calculate the probability that a student with
% Score 20 on exam 1 and score 80 on exam 2
% will not be admitted
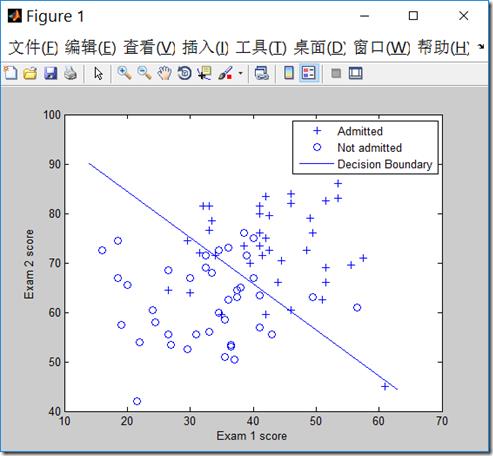
prob = 1 - g([1, 20, 80]*theta)

%画出分界面
% Plot Newton\'s method result
% Only need 2 points to define a line, so choose two endpoints
plot_x = [min(x(:,2))-2,  max(x(:,2))+2];
% 画出概率g(theta^Tx)=0.5的分界线,解出对应的theta值
plot_y = (-1./theta(3)).*(theta(2).*plot_x +theta(1));
plot(plot_x, plot_y)
legend(\'Admitted\', \'Not admitted\', \'Decision Boundary\')
hold off

% Plot J
figure
plot(0:MAX_ITR-1, J, \'o--\', \'MarkerFaceColor\', \'r\', \'MarkerSize\', 8)
xlabel(\'Iteration\'); ylabel(\'J\')
% Display J
J
View Code

clear all; close all; clc x = load(\'ex4x.dat\'); y = load(\'ex4y.dat\'); [m, n] = size(x); x = [ones(m, 1), x]; % 输入特征增加一列,x0=1 figure pos = find(y); neg = find(y == 0);%find是找到的一个向量,其结果是find函数括号值为真时的值的行号 plot(x(pos, 2), x(pos,3), \'+\') hold on plot(x(neg, 2), x(neg, 3), \'o\') hold on xlabel(\'Exam 1 score\') ylabel(\'Exam 2 score\') theta = zeros(n+1, 1);%初始化theta值 g = inline(\'1.0 ./ (1.0 + exp(-z))\'); %定义logistic函数 % Newton\'s method MAX_ITR = 7; J = zeros(MAX_ITR, 1); for i = 1:MAX_ITR % Calculate the hypothesis function z = x * theta; h = g(z);%转换成logistic函数 % Calculate gradient and hessian. % The formulas below are equivalent to the summation formulas % given in the lecture videos. grad = (1/m).*x\' * (h-y);%梯度的矢量表示法 %diag(h),返回向量h为对角线元素的方阵 H = (1/m).*x\' * diag(h) * diag(1-h) * x;%hessian矩阵的矢量表示法 % Calculate J (for testing convergence) J(i) =(1/m)*sum(-y.*log(h) - (1-y).*log(1-h));%损失函数的矢量表示法 theta = theta - H\\grad;%H\\逆矩阵 end % Display theta theta % Calculate the probability that a student with % Score 20 on exam 1 and score 80 on exam 2 % will not be admitted prob = 1 - g([1, 20, 80]*theta) %画出分界面 % Plot Newton\'s method result % Only need 2 points to define a line, so choose two endpoints plot_x = [min(x(:,2))-2, max(x(:,2))+2]; % 画出概率g(theta^Tx)=0.5的分界线,解出对应的theta值 plot_y = (-1./theta(3)).*(theta(2).*plot_x +theta(1)); plot(plot_x, plot_y) legend(\'Admitted\', \'Not admitted\', \'Decision Boundary\') hold off % Plot J figure plot(0:MAX_ITR-1, J, \'o--\', \'MarkerFaceColor\', \'r\', \'MarkerSize\', 8) xlabel(\'Iteration\'); ylabel(\'J\') % Display J J
以上是关于对线性回归,logistic回归的认识的主要内容,如果未能解决你的问题,请参考以下文章


