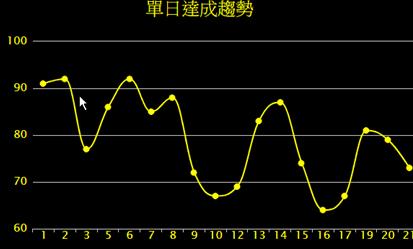
highcharts曲线图
Posted 欣欣点灯
tags:
篇首语:本文由小常识网(cha138.com)小编为大家整理,主要介绍了highcharts曲线图相关的知识,希望对你有一定的参考价值。
效果:

隐藏 xy 轴说明
.highcharts-legend {
    display:none
}
Json 数据:
var days =[];
var achievingrates=[]
_.each(data, function (item)
{
    days.push(item.day);
    achievingrates.push(item.achievingrate);
});
chart1.xAxis[0].setCategories(days);
chart1.series[0].setData(achievingrates);
定义:
chart1 = new Highcharts.Chart({
    chart: {
        type: \'spline\',
        renderTo: \'container\',
        backgroundColor: \'rgba(0,0,0,0)\'--背景色
    },
    title: {
        text: \'單日達成趨勢\',
        x: -20, //center
        style: {
            fontSize:\'25px\',--字体大小颜色
            color: "#FFFF00",
            fill: \'#FFFFFF\'
        }
    },
    xAxis: {
        categories: [\'一月\', \'二月\', \'三月\', \'四月\', \'五月\', \'六月\', \'七月\', \'八月\', \'九月\', \'十月\', \'十一月\', \'十二月\'],
        labels: {
            style:
            {
                color: "#FFFF00",--横轴字体大小颜色
                fontSize: "15px"
            }
        }
    },
    yAxis: {
        title: {
            text: \'\'
        },
        labels: {
            formatter: function () {
                return this.value + \'\'
            },
            style:
            {
                color: "#FFFF00",--y轴颜色大小
                fontSize: "15px"
            }
        }
    },
    tooltip: {
        crosshairs: true,
        shared: true
    },
    colors: [\'#FFFF00\'],--线条颜色
    plotOptions: {
        spline: {
            marker: {
                radius: 4,
                lineColor: \'#FFFF00\',--线条颜色
                lineWidth: 1
            }
        },
    },
    series: [{
        data: [7.0, 6.9, 9.5, 14.5, 18.2, 21.5, 25.2, 26.5, 23.3, 18.3, 13.9, 9.6]
    }]
});
以上是关于highcharts曲线图的主要内容,如果未能解决你的问题,请参考以下文章