highcharts饼图
Posted 欣欣点灯
tags:
篇首语:本文由小常识网(cha138.com)小编为大家整理,主要介绍了highcharts饼图相关的知识,希望对你有一定的参考价值。
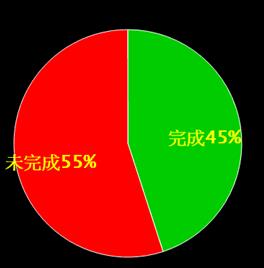
效果:

JSON加载数据:
var chartseries2 = [
    {
        name: \'完成\' + data.rate + \'%\',
        y: data.rate
    },
    {
        name: \'未完成\' + data.rateless + \'%\',
        y: data.rateless
    }];
chart2.series[0].setData(chartseries2);
定义:
chart2 = new Highcharts.Chart({
    chart: {
        plotBackgroundColor: null,
        plotBorderWidth: null,
        plotShadow: false,
        renderTo: \'container2\',
        type: \'pie\',
        backgroundColor: \'rgba(0,0,0,0)\' --设置背景色
    },
    title: {
        text: \'\'
    },
    tooltip: {
        pointFormat: \'{series.name}: <b>{point.percentage:.1f}%</b>\'
    },
    colors: [\'#00DD00\', \'#FF0000\'],
    plotOptions: {
        pie: {
            size: \'100%\',
            allowPointSelect: true,
            cursor: \'pointer\',
            dataLabels: {
                enabled: true,
                color: \'#FFFF00\',
                distance: -50, --设置偏移,使文字显示在图形内
                connectorColor: \'#000000\',
                format: \'<b>{point.name}</b>\',
                style: {
                    fontWeight: 0,
                    fontSize: "25px"--设置文字大小
                }
            },
            formatter: function (index) {
                return \'<span style="color:#00008B;font-weight:bold">\' + this.point.name + \'</span>\';
            },
            showInLegend: true
        }
    },
    series: [{
        data: [
            {
                name: \'完成80%\',
                y: 80
            },
            {
                name: \'未完成20%\',
                y: 20
            }
        ]
    }]
});
以上是关于highcharts饼图的主要内容,如果未能解决你的问题,请参考以下文章