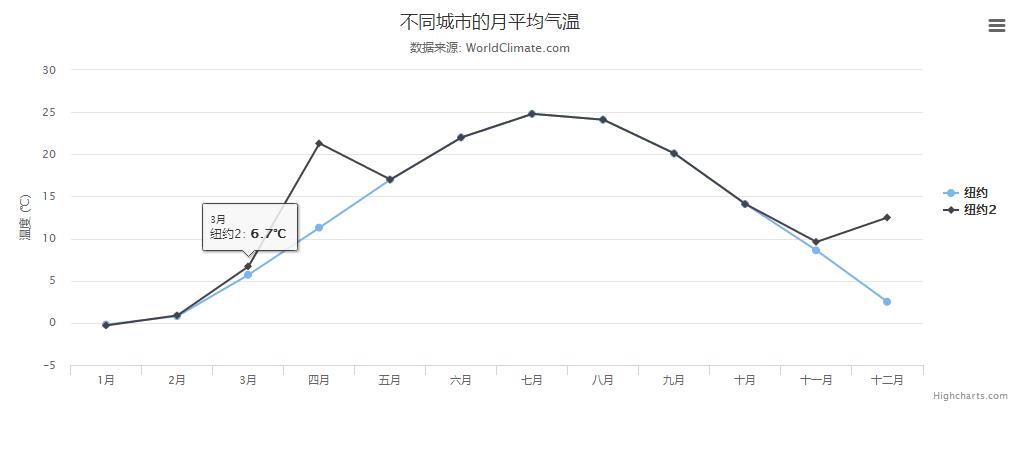
highcharts 动态生成x轴和折线图
Posted zhao1949
tags:
篇首语:本文由小常识网(cha138.com)小编为大家整理,主要介绍了highcharts 动态生成x轴和折线图相关的知识,希望对你有一定的参考价值。
highchart 动态生成x轴和折线图
<!DOCTYPE html>
<html>
    <head>
        <meta charset="utf-8"><link rel="icon" href="https://static.jianshukeji.com/highcharts/images/favicon.ico">
        <meta name="viewport" content="width=device-width, initial-scale=1">
        <style>
            /* css 代码  */
        </style>
        <script src="https://img.hcharts.cn/highcharts/highcharts.js"></script>
        <script src="https://img.hcharts.cn/highcharts/modules/exporting.js"></script>
        <script src="https://img.hcharts.cn/highcharts-plugins/highcharts-zh_CN.js"></script>
    </head>
    <body>
        <div id="container" style="min-width:400px;height:400px"></div>
        <script>
        var chart = new Highcharts.Chart(\'container\', {
            title: {
                text: \'不同城市的月平均气温\',
                x: -20
            },
            subtitle: {
                text: \'数据来源: WorldClimate.com\',
                x: -20
            },
            xAxis: {
                categories: [\'一月\', \'二月\', \'三月\', \'四月\', \'五月\', \'六月\', \'七月\', \'八月\', \'九月\', \'十月\', \'十一月\', \'十二月\']
            },
            yAxis: {
                title: {
                    text: \'温度 (°C)\'
                },
                plotLines: [{
                    value: 0,
                    width: 1,
                    color: \'#808080\'
                }]
            },
            tooltip: {
                valueSuffix: \'°C\'
            },
            legend: {
                layout: \'vertical\',
                align: \'right\',
                verticalAlign: \'middle\',
                borderWidth: 0
            },
            series: []
        });
        chart.xAxis[0].categories = [\'1月\', \'2月\', \'3月\', \'四月\', \'五月\', \'六月\', \'七月\', \'八月\', \'九月\', \'十月\', \'十一月\', \'十二月\'];
        var series = chart.addSeries({
               name: \'纽约\',
                data: [-0.2, 0.8, 5.7, 11.3, 17.0, 22.0, 24.8, 24.1, 20.1, 14.1, 8.6, 2.5]
          }, true);

        var series = chart.addSeries({
               name: \'纽约2\',
                data: [-0.3, 0.89, 6.7, 21.3, 17.0, 22.0, 24.8, 24.1, 20.1, 14.1, 9.6, 12.5]
          }, true);
        </script>
    </body>
</html>

参考:
[已解决] HighStock如何动态添加数据组
https://bbs.hcharts.cn/thread-43-1-1.html
以上是关于highcharts 动态生成x轴和折线图的主要内容,如果未能解决你的问题,请参考以下文章