求教用matlab 实现最小二乘法拟合曲线的问题
Posted
tags:
篇首语:本文由小常识网(cha138.com)小编为大家整理,主要介绍了求教用matlab 实现最小二乘法拟合曲线的问题相关的知识,希望对你有一定的参考价值。
数据如下:x=(1,2,3,4,5,6,7,8,9,10)
y=( 96.31, 135.44, 79.5, 56.54, 256.21, 350.68, 105.62, 185.03, 493.08, 1031.17, 860.06, 746.78)
表达式为:Y = a x4+b x3+c x2+d x+e
求:a,b,c,d,e,以及 可靠度 ,请高手赐教,怎么用matlab 实现,本人菜鸟,请说详细点
谢谢各位,但能不能详细说一下怎么确定拟合曲线的精确度?
另:修改x=(1,2,3,4,5,6,7,8,9,10,11,12) ,上面后两个数忘了加上了。
具体你的问题:
x=[1,2,3,4,5,6,7,8,9,10,11,12]
y=[ 96.31, 135.44, 79.5, 56.54, 256.21, 350.68, 105.62, 185.03, 493.08, 1031.17, 860.06, 746.78]
z=polyfit(x,y,4)
ans =
-0.9026 22.3624 -171.6814 489.5975 -287.8153 参考技术A y比x多出了两位,我删除了后两位;
代码如下:
function poly4(x,y)
%POLY4 Create plot of datasets and fits
% POLY4(X,Y)
% Creates a plot, similar to the plot in the main curve fitting
% window, using the data that you provide as input. You can
% apply this function to the same data you used with cftool
% or with different data. You may want to edit the function to
% customize the code and this help message.
%
% Number of datasets: 1
% Number of fits: 1
% Data from dataset "y vs. x":
% X = x:
% Y = y:
% Unweighted
%
% This function was automatically generated on 27-Mar-2009 21:43:52
% Set up figure to receive datasets and fits
f_ = clf;
figure(f_);
set(f_,'Units','Pixels','Position',[326 106 680 484]);
legh_ = []; legt_ = ; % handles and text for legend
xlim_ = [Inf -Inf]; % limits of x axis
ax_ = axes;
set(ax_,'Units','normalized','OuterPosition',[0 0 1 1]);
set(ax_,'Box','on');
axes(ax_); hold on;
% --- Plot data originally in dataset "y vs. x"
x = x(:);
y = y(:);
h_ = line(x,y,'Parent',ax_,'Color',[0.333333 0 0.666667],...
'LineStyle','none', 'LineWidth',1,...
'Marker','.', 'MarkerSize',12);
xlim_(1) = min(xlim_(1),min(x));
xlim_(2) = max(xlim_(2),max(x));
legh_(end+1) = h_;
legt_end+1 = 'y vs. x';
% Nudge axis limits beyond data limits
if all(isfinite(xlim_))
xlim_ = xlim_ + [-1 1] * 0.01 * diff(xlim_);
set(ax_,'XLim',xlim_)
else
set(ax_, 'XLim',[0.91000000000000003, 10.09]);
end
% --- Create fit "fit 1"
ok_ = isfinite(x) & isfinite(y);
if ~all( ok_ )
warning( 'GenerateMFile:IgnoringNansAndInfs', ...
'Ignoring NaNs and Infs in data' );
end
ft_ = fittype('poly4');
% Fit this model using new data
cf_ = fit(x(ok_),y(ok_),ft_);
% Or use coefficients from the original fit:
if 0
cv_ = 1.9494012237762368, -37.46559731934768, 242.74933129370976, -576.15945804197111, 496.91083333334984;
cf_ = cfit(ft_,cv_:);
end
% Plot this fit
h_ = plot(cf_,'fit',0.95);
legend off; % turn off legend from plot method call
set(h_(1),'Color',[1 0 0],...
'LineStyle','-', 'LineWidth',2,...
'Marker','none', 'MarkerSize',6);
legh_(end+1) = h_(1);
legt_end+1 = 'fit 1';
% Done plotting data and fits. Now finish up loose ends.
hold off;
leginfo_ = 'Orientation', 'vertical', 'Location', 'NorthEast';
h_ = legend(ax_,legh_,legt_,leginfo_:); % create legend
set(h_,'Interpreter','none');
xlabel(ax_,''); % remove x label
ylabel(ax_,''); % remove y label
结果:
Linear model Poly4:
f(x) = p1*x^4 + p2*x^3 + p3*x^2 + p4*x + p5
Coefficients (with 95% confidence bounds):
p1 = 1.949 (-0.1406, 4.039)
p2 = -37.47 (-83.7, 8.768)
p3 = 242.7 (-103.2, 588.7)
p4 = -576.2 (-1575, 422.8)
p5 = 496.9 (-389.4, 1383)
Goodness of fit:
SSE: 5.445e+004
R-square: 0.9319
Adjusted R-square: 0.8774
RMSE: 104.4 参考技术B 请使用多项式拟合函数polyfit(x,y,n),其中x是你要你和的自变量,y是你要拟合的因变量,n是你要用到的拟合多项式的最高次数,函数返回这个多项式。
详见MATLAB帮助文档:polyfit
最小二乘法多项式曲线拟合原理与实现(转)
概念
最小二乘法多项式曲线拟合,根据给定的m个点,并不要求这条曲线精确地经过这些点,而是曲线y=f(x)的近似曲线y= φ(x)。
原理
[原理部分由个人根据互联网上的资料进行总结,希望对大家能有用]
给定数据点pi(xi,yi),其中i=1,2,…,m。求近似曲线y= φ(x)。并且使得近似曲线与y=f(x)的偏差最小。近似曲线在点pi处的偏差δi= φ(xi)-y,i=1,2,...,m。
常见的曲线拟合方法:
1.使偏差绝对值之和最小
![]()
2.使偏差绝对值最大的最小
![]()
3.使偏差平方和最小
![]()
按偏差平方和最小的原则选取拟合曲线,并且采取二项式方程为拟合曲线的方法,称为最小二乘法。
推导过程:
1. 设拟合多项式为:

2. 各点到这条曲线的距离之和,即偏差平方和如下:

3. 为了求得符合条件的a值,对等式右边求ai偏导数,因而我们得到了:


.......

4. 将等式左边进行一下化简,然后应该可以得到下面的等式:


.......

5. 把这些等式表示成矩阵的形式,就可以得到下面的矩阵:

6. 将这个范德蒙得矩阵化简后可得到:

7. 也就是说X*A=Y,那么A = (X‘*X)-1*X‘*Y,便得到了系数矩阵A,同时,我们也就得到了拟合曲线。
实现
运行前提:
- Python运行环境与编辑环境;
- Matplotlib.pyplot图形库,可用于快速绘制2D图表,与matlab中的plot命令类似,而且用法也基本相同。
代码:
- # coding=utf-8
- ‘‘‘‘‘
- 作者:Jairus Chan
- 程序:多项式曲线拟合算法
- ‘‘‘
- import matplotlib.pyplot as plt
- import math
- import numpy
- import random
- fig = plt.figure()
- ax = fig.add_subplot(111)
- #阶数为9阶
- order=9
- #生成曲线上的各个点
- x = numpy.arange(-1,1,0.02)
- y = [((a*a-1)*(a*a-1)*(a*a-1)+0.5)*numpy.sin(a*2) for a in x]
- #ax.plot(x,y,color=‘r‘,linestyle=‘-‘,marker=‘‘)
- #,label="(a*a-1)*(a*a-1)*(a*a-1)+0.5"
- #生成的曲线上的各个点偏移一下,并放入到xa,ya中去
- i=0
- xa=[]
- ya=[]
- for xx in x:
- yy=y[i]
- d=float(random.randint(60,140))/100
- #ax.plot([xx*d],[yy*d],color=‘m‘,linestyle=‘‘,marker=‘.‘)
- i+=1
- xa.append(xx*d)
- ya.append(yy*d)
- ‘‘‘‘‘for i in range(0,5):
- xx=float(random.randint(-100,100))/100
- yy=float(random.randint(-60,60))/100
- xa.append(xx)
- ya.append(yy)‘‘‘
- ax.plot(xa,ya,color=‘m‘,linestyle=‘‘,marker=‘.‘)
- #进行曲线拟合
- matA=[]
- for i in range(0,order+1):
- matA1=[]
- for j in range(0,order+1):
- tx=0.0
- for k in range(0,len(xa)):
- dx=1.0
- for l in range(0,j+i):
- dx=dx*xa[k]
- tx+=dx
- matA1.append(tx)
- matA.append(matA1)
- #print(len(xa))
- #print(matA[0][0])
- matA=numpy.array(matA)
- matB=[]
- for i in range(0,order+1):
- ty=0.0
- for k in range(0,len(xa)):
- dy=1.0
- for l in range(0,i):
- dy=dy*xa[k]
- ty+=ya[k]*dy
- matB.append(ty)
- matB=numpy.array(matB)
- matAA=numpy.linalg.solve(matA,matB)
- #画出拟合后的曲线
- #print(matAA)
- xxa= numpy.arange(-1,1.06,0.01)
- yya=[]
- for i in range(0,len(xxa)):
- yy=0.0
- for j in range(0,order+1):
- dy=1.0
- for k in range(0,j):
- dy*=xxa[i]
- dy*=matAA[j]
- yy+=dy
- yya.append(yy)
- ax.plot(xxa,yya,color=‘g‘,linestyle=‘-‘,marker=‘‘)
- ax.legend()
- plt.show()
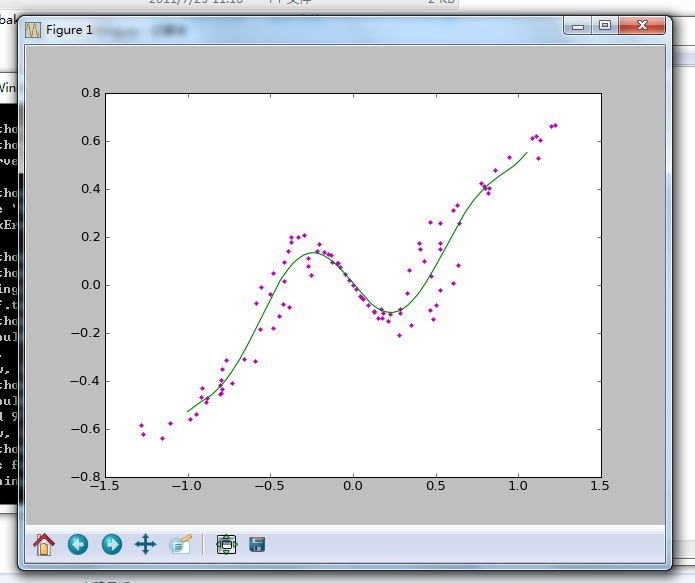
运行效果:

本博客中所有的博文都为笔者(Jairus Chan)原创。
如需转载,请标明出处:http://blog.csdn.net/JairusChan。
如果您对本文有任何的意见与建议,请联系笔者(JairusChan)。
http://blog.csdn.net/jairuschan/article/details/7517773/
以上是关于求教用matlab 实现最小二乘法拟合曲线的问题的主要内容,如果未能解决你的问题,请参考以下文章