najios 怎么监控nginx日志
Posted
tags:
篇首语:本文由小常识网(cha138.com)小编为大家整理,主要介绍了najios 怎么监控nginx日志相关的知识,希望对你有一定的参考价值。
1.在被控端执行操作:把check_nginx插件放进/usr/local/nagios/libexec,并且授权属主和属组为nagios(这点非常关键)[root@Jiechao libexec]# ll check_nginx
-rwxr-xr-x 1 nagios nagios 7636 Oct 23 22:48 check_nginx
2.vi /usr/local/nagios/etc/nrpe.cfg
添加这行:command[check_nginx]=/usr/local/nagios/libexec/check_nginx -w 15000 -c 20000
3.重启Nrpe:
killall -9 nrpe
/usr/local/nagios/bin/nrpe -c /usr/local/nagios/etc/nrpe.cfg -d
4.被控端执行操作测试:
[root@Jiechao libexec]# ./check_nginx -H 192.168.0.100 -P 80 -p /var/run/ -n nginx.pid -s nginx_status -o /tmp/ -w 15000 -c 20000
OK - nginx is running. 1 requests per second, 1 connections per second (1.00 requests per connection) | \'reqpsec\'=1 \'conpsec\'=1 \'conpreq\'=1.00 ]
--------------------------------------------------------------------------------------------------------------------------------------------------
下面在Nagios Server端操作:
1.vi /usr/local/nagios/etc/objects/service.cfg
添加:
define service
use generic-service
host_name Nagios-server,Nagios-client
service_description check_nginx
check_command check_nrpe!check_nginx
max_check_attempts 3
normal_check_interval 3
retry_check_interval 3
check_period 24x7
notification_interval 5
notification_period 24x7
notification_options w,u,c,r
contact_groups admins
process_perf_data 1
action_url /nagios/pnp/index.php?host=$HOSTNAME$&srv=$SERVICEDESC$
添加完,保存退出,重启Nagios即可。
/etc/init.d/nagios relaod
/etc/init.d/nagios restart
2.测试:/usr/local/nagios/libexec/check_nrpe -H 192.168.0.100 -c check_nginx
OK - nginx is running. 1 requests per second, 1 connections per second (1.00 requests per connection) | \'reqpsec\'=1 \'conpsec\'=1 \'conpreq\'=1.00 ]
#---------------------192.168.0.100是我被控端的ip地址------------------------------------------------------
下面是一些注意的地方--
1、关于nginx.pid
--在nginx.conf一定要加上,如:pid /opt/nginx.pid
2、如果出现以下提示.
--UNKNOWN - Local copy/copies of nginx_status is empty.
--可能就是在你的nginx.conf没有配置状态监控,如
server
listen 80;
server_name IP | 域名;
location /nginx_status
stub_status on;
access_log off;
3.需要更改check_nginx 一个地方:
把hostname="localhost"改为:你需要监控的主机ip。
如:hostname="192.168.0.100"
check_nginx 脚本
#!/bin/sh
PROGNAME=`basename $0`
VERSION="Version 1.0,"
AUTHOR="2009, Mike Adolphs (http://www.matejunkie.com/)"
ST_OK=0
ST_WR=1
ST_CR=2
ST_UK=3
hostname="192.168.0.100"
port=80
path_pid=/var/run
name_pid="nginx.pid"
status_page="nginx_status"
output_dir=/tmp
pid_check=1
secure=0
print_version()
echo "$VERSION $AUTHOR"
print_help()
print_version $PROGNAME $VERSION
echo ""
echo "$PROGNAME is a Nagios plugin to check whether nginx is running."
echo "It also parses the nginx\'s status page to get requests and"
echo "connections per second as well as requests per connection. You"
echo "may have to alter your nginx configuration so that the plugin"
echo "can access the server\'s status page."
echo "The plugin is highly configurable for this reason. See below for"
echo "available options."
echo ""
echo "$PROGNAME -H localhost -P 80 -p /var/run -n nginx.pid "
echo " -s nginx_statut -o /tmp [-w INT] [-c INT] [-S] [-N]"
echo ""
echo "Options:"
echo " -H/--hostname)"
echo " Defines the hostname. Default is: localhost"
echo " -P/--port)"
echo " Defines the port. Default is: 80"
echo " -p/--path-pid)"
echo " Path where nginx\'s pid file is being stored. You might need"
echo " to alter this path according to your distribution. Default"
echo " is: /var/run"
echo " -n/--name_pid)"
echo " Name of the pid file. Default is: nginx.pid"
echo " -N/--no-pid-check)"
echo " Turn this on, if you don\'t want to check for a pid file"
echo " whether nginx is running, e.g. when you\'re checking a"
echo " remote server. Default is: off"
echo " -s/--status-page)"
echo " Name of the server\'s status page defined in the location"
echo " directive of your nginx configuration. Default is:"
echo " nginx_status"
echo " -o/--output-directory)"
echo " Specifies where to write the tmp-file that the check creates."
echo " Default is: /tmp"
echo " -S/--secure)"
echo " In case your server is only reachable via SSL, use this"
echo " this switch to use HTTPS instead of HTTP. Default is: off"
echo " -w/--warning)"
echo " Sets a warning level for requests per second. Default is: off"
echo " -c/--critical)"
echo " Sets a critical level for requests per second. Default is:"
echo " off"
exit $ST_UK
while test -n "$1"; do
case "$1" in
-help|-h)
print_help
exit $ST_UK
;;
--version|-v)
print_version $PROGNAME $VERSION
exit $ST_UK
;;
--hostname|-H)
hostname=$2
shift
;;
--port|-P)
port=$2
shift
;;
--path-pid|-p)
path_pid=$2
shift
;;
--name-pid|-n)
name_pid=$2
shift
;;
--no-pid-check|-N)
pid_check=0
;;
--status-page|-s)
status_page=$2
shift
;;
--output-directory|-o)
output_dir=$2
shift
;;
--secure|-S)
secure=1
;;
--warning|-w)
warning=$2
shift
;;
--critical|-c)
critical=$2
shift
;;
*)
echo "Unknown argument: $1"
print_help
exit $ST_UK
;;
esac
shift
done
get_wcdiff()
if [ ! -z "$warning" -a ! -z "$critical" ]
then
wclvls=1
if [ $warning -gt $critical ]
then
wcdiff=1
fi
elif [ ! -z "$warning" -a -z "$critical" ]
then
wcdiff=2
elif [ -z "$warning" -a ! -z "$critical" ]
then
wcdiff=3
fi
val_wcdiff()
if [ "$wcdiff" = 1 ]
then
echo "Please adjust your warning/critical thresholds. The warning \\
must be lower than the critical level!"
exit $ST_UK
elif [ "$wcdiff" = 2 ]
then
echo "Please also set a critical value when you want to use \\
warning/critical thresholds!"
exit $ST_UK
elif [ "$wcdiff" = 3 ]
then
echo "Please also set a warning value when you want to use \\
warning/critical thresholds!"
exit $ST_UK
fi
check_pid()
if [ -f "$path_pid/$name_pid" ]
then
retval=0
else
retval=1
fi
get_status()
if [ "$secure" = 1 ]
then
wget --no-check-certificate -q -t 3 -T 3 \\
http://$hostname:$port/$status_page -O $output_dir/nginx-status.1
sleep 1
wget --no-check-certificate -q -t 3 -T 3 \\
http://$hostname:$port/$status_page -O $output_dir/nginx-status.2
else
wget -q -t 3 -T 3 http://$hostname:$port/$status_page \\
-O $output_dir/nginx-status.1
sleep 1
wget -q -t 3 -T 3 http://$hostname:$port/$status_page \\
-O $output_dir/nginx-status.2
fi
stat_output1=`stat -c %s $output_dir/nginx-status.1`
stat_output2=`stat -c %s $output_dir/nginx-status.2`
if [ "$stat_output1" = 0 -o "$stat_output2" = 0 ]
then
echo "UNKNOWN - Local copy/copies of $status_page is empty."
exit $ST_UK
fi
get_vals()
tmp1_reqpsec=`grep \'^ \' $output_dir/nginx-status.1|awk \'print $3\'`
tmp2_reqpsec=`grep \'^ \' $output_dir/nginx-status.2|awk \'print $3\'`
reqpsec=`expr $tmp2_reqpsec - $tmp1_reqpsec`
tmp1_conpsec=`grep \'^ \' $output_dir/nginx-status.1|awk \'print $2\'`
tmp2_conpsec=`grep \'^ \' $output_dir/nginx-status.2|awk \'print $2\'`
conpsec=`expr $tmp2_conpsec - $tmp1_conpsec`
reqpcon=`echo "scale=2; $reqpsec / $conpsec" | bc -l`
if [ "$reqpcon" = ".99" ]
then
reqpcon="1.00"
fi
do_output()
output="nginx is running. $reqpsec requests per second, $conpsec \\
connections per second ($reqpcon requests per connection)"
do_perfdata()
perfdata="\'reqpsec\'=$reqpsec \'conpsec\'=$conpsec \'conpreq\'=$reqpcon"
# Here we go!
get_wcdiff
val_wcdiff
if [ $pid_check = 1 ]
then
check_pid
if [ "$retval" = 1 ]
then
echo "There\'s no pid file for nginx. Is nginx running? Please \\
also make sure whether your pid path and name is correct."
exit $ST_CR
fi
fi
get_status
get_vals
do_output
do_perfdata
if [ -n "$warning" -a -n "$critical" ]
then
if [ "$reqpsec" -ge "$warning" -a "$reqpsec" -lt "$critical" ]
then
echo "WARNING - $output | $perfdata"
exit $ST_WR
elif [ "$reqpsec" -ge "$critical" ]
then
echo "CRITICAL - $output | $perfdata"
exit $ST_CR
else
echo "OK - $output | $perfdata ]"
exit $ST_OK
fi
else
echo "OK - $output | $perfdata"
exit $ST_OK
fi 参考技术A 1.在被控端执行操作:把check_nginx插件放进/usr/local/nagios/libexec,并且授权属主和属组为nagios(这点非常关键)
[root@Jiechao libexec]# ll check_nginx
-rwxr-xr-x 1 nagios nagios 7636 Oct 23 22:48 check_nginx
2.vi /usr/local/nagios/etc/nrpe.cfg
添加这行:command[check_nginx]=/usr/local/nagios/libexec/check_nginx -w 15000 -c 20000
3.重启Nrpe:
killall -9 nrpe
/usr/local/nagios/bin/nrpe -c /usr/local/nagios/etc/nrpe.cfg -d
ELK整合Filebeat监控nginx日志
ELK 日志分析
1. 为什么用到 ELK
一般我们需要进行日志分析场景:直接在日志文件中 grep、 awk 就可以获得自己想要的信息。
但在规模较大的场景中,此方法效率低下,面临问题包括日志量太大如何归档、文本搜索太慢怎么办、
如何多维度查询。需要集中化的日志管理,所有服务器上的日志收集汇总。常见解决思路是建立集中
式日志收集系统,将所有节点上的日志统一收集,管理,访问。
一般大型系统是一个分布式部署的架构,不同的服务模块部署在不同的服务器上,问题出现时,
大部分情况需要根据问题暴露的关键信息,定位到具体的服务器和服务模块,构建一套集中式日志系
统,可以提高定位问题的效率。
一个完整的集中式日志系统,需要包含以下几个主要特点:
收集-能够采集多种来源的日志数据
传输-能够稳定的把日志数据传输到中央系统
存储-如何存储日志数据
分析-可以支持 UI 分析
警告-能够提供错误报告,监控机制 ELK 提供了一整套解决方案,并且都是开源软件,之间互相配
合使用,完美衔接,高效的满足了很多场合的应用。目前主流的一种日志系统。
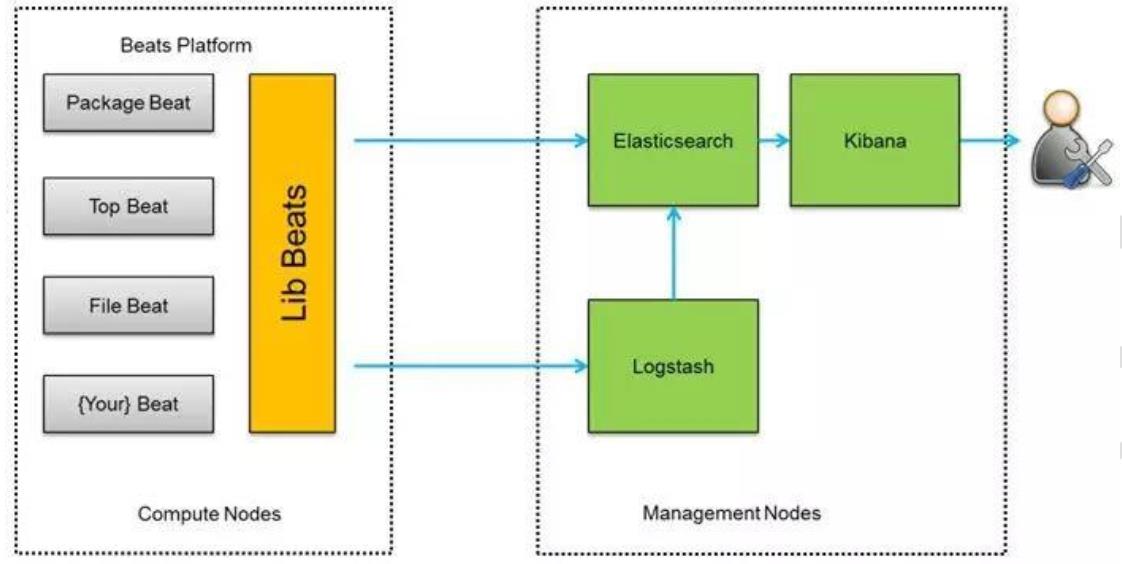
2.ELK简介
ELK 是三个开源软件的缩写,分别表示: Elasticsearch , Logstash, Kibana , 它们都是开源软件。新增了
一个 FileBeat,它是一个轻量级的日志收集处理工具(Agent), Filebeat 占用资源少,适合于在各个服务
器上搜集日志后传输给 Logstash,官方也推荐此工具。
Elasticsearch 是个开源分布式搜索引擎,提供搜集、分析、存储数据三大功能。它的特点有:分布式,
零配置,自动发现,索引自动分片,索引副本机制, restful 风格接口,多数据源,自动搜索负载等。
Logstash 主要是用来日志的搜集、分析、过滤日志的工具,支持大量的数据获取方式。一般工作方式
为 c/s 架构, client 端安装在需要收集日志的主机上, server 端负责将收到的各节点日志进行过滤、修
改等操作在一并发往 elasticsearch 上去。
Kibana 也是一个开源和免费的工具, Kibana 可以为 Logstash 和 ElasticSearch 提供的日志分析友好
的 Web 界面,可以帮助汇总、分析和搜索重要数据日志。
Filebeat 隶属于 Beats。目前 Beats 包含四种工具:
Packetbeat(搜集网络流量数据)
Topbeat(搜集系统、进程和文件系统级别的 CPU 和内存使用情况等数据)
Filebeat(搜集文件数据)
Winlogbeat(搜集 Windows 事件日志数据)
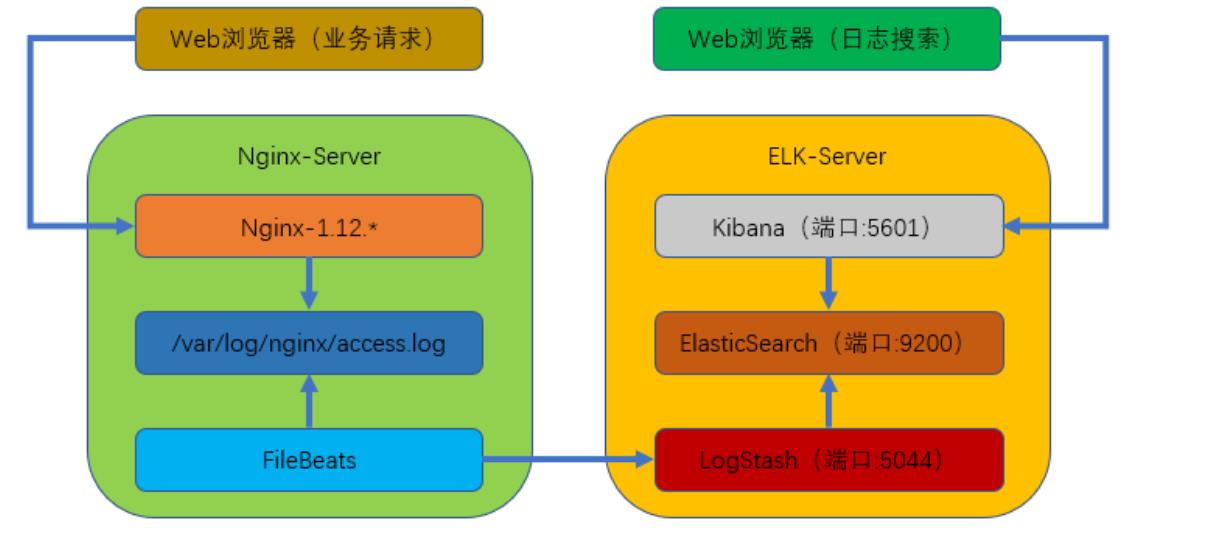
3. 实验部署
本次部署的是 filebeats(客户端), logstash+elasticsearch+kibana(服务端)组成的架构。
业务请求到达 nginx-server 机器上的 Nginx; Nginx 响应请求,并在 access.log 文件中增加访问记
录; FileBeat 搜集新增的日志,通过 LogStash 的 5044 端口上传日志; LogStash 将日志信息通过本
机的 9200 端口传入到 ElasticSerach; 搜索日志的用户通过浏览器访问 Kibana,服务器端口是 5601;
Kibana 通过 9200 端口访问 ElasticSerach;
实验环境:
本次部署的是单点 ELK 用了两台机器(CentOS7)
ELK 服务端: 192.168.180.113
Nginx 客户端: 192.168.180.112
1. 准备工作:
配置好网络 yum 源
# wget http://mirrors.aliyun.com/repo/Centos-7.repo
# wget http://mirrors.aliyun.com/repo/epel-7.repo
关闭防火墙: systemctl stop(disable) firewalld
关闭 SELinux: SELINUX=disabled
2. 下载并安装软件包:
# mkdir /elk;cd /elk
# wget https://artifacts.elastic.co/downloads/elasticsearch/elasticsearch-6.2.3.tar.gz
# wget https://artifacts.elastic.co/downloads/logstash/logstash-6.2.3.tar.gz
# wget https://artifacts.elastic.co/downloads/kibana/kibana-6.2.3-linux-x86_64.tar.gz
全部解压缩,并复制到/usr/local/目录下
3. 安装 JDK(java)环境工具:
# yum -y install java-1.8*
4. 配置 elasticsearch:
1) 新建 elasticsearch 用户并启动(用 elasticsearch 普通用户启动)
# useradd es
# chown -R elasticsearch.elasticsearch /mnt/elasticsearch-6.2.3/
[root@topcheer elasticsearch-6.2.3]# su - es
上一次登录:日 9月 29 22:53:43 CST 2019pts/1 上
[es@topcheer ~]$ cd /mnt
[es@topcheer mnt]$ ll
总用量 4175516
drwxr-xr-x  9 root root       160 10月  4 20:30 apache-tomcat-7.0.70
drwxr-xr-x  9 root root       160 11月  4 01:25 apache-tomcat-7.0.70_1
-rw-r--r--  1 root root   8924465 10月  4 20:30 apache-tomcat-7.0.70.tar.gz
-rw-r--r--  1 root root       540 9月  21 22:14 Dockerfile
drwxr-xr-x  9 es   es         155 9月  21 22:58 elasticsearch-6.2.3
-rw-r--r--  1 root root  29050159 9月  21 22:45 elasticsearch-6.2.3.tar.gz
-rw-r--r--  1 root root       128 9月  29 21:47 elasticsearch.yml
-rw-r--r--  1 root root 780598784 9月  29 21:27 es.tar
-rw-r--r--  1 root root 412774002 5月  30 2018 gitlab-ce-10.8.2-ce.0.el7.x86_64.rpm
drwxr-xr-x  2 root root       100 11月  4 01:08 harbor
-rw-r--r--  1 root root 552897681 11月  4 01:07 harbor-offline-installer-v1.8.0.tgz
-rw-r--r--  1 root root 619113214 11月  4 00:38 harbor-offline-installer-v1.9.1.tgz
-rw-r--r--  1 root root  78245883 9月  30 14:25 jenkins.war
drwxrwxr-x 12 wgr  wgr        249 9月  21 23:34 kibana-6.2.3-linux-x86_64
-rw-r--r--  1 root root  83426328 9月  21 22:45 kibana-6.2.3-linux-x86_64.tar.gz
-rw-r--r--  1 root root 768809984 9月  29 21:29 kibana.tar
-rw-r--r--  1 root root  17446309 9月  21 22:12 logstash-0.0.1-SNAPSHOT.jar
drwxr-xr-x 12 root root       289 9月  22 12:32 logstash-6.2.3
-rw-r--r--  1 root root 138221072 9月  21 22:45 logstash-6.2.3.tar.gz
-rw-r--r--  1 root root 677771264 9月  29 21:31 logstash.tar
drwxrwxr-x  3 root root        48 8月   4 2018 __MACOSX
drwxr-xr-x 10 root root       171 10月 24 23:34 nacos
-rw-r--r--  1 root root  44275341 10月 24 23:25 nacos.tar.gz
drwxr-xr-x  9 es   es         186 10月  4 21:41 nginx-1.12.2
-rw-r--r--  1 root root    981687 10月  4 20:30 nginx-1.12.2.tar.gz
drwxr-xr-x  9 1169 1169     12288 10月  4 21:40 pcre-8.37
-rw-r--r--  1 root root   2041593 10月  4 20:30 pcre-8.37.tar.gz
drwxr-xr-x 19 root root      4096 11月 19 21:41 Python-3.7.0
-rw-r--r--  1 root root  26047619 11月 19 21:33 Python-3.7.0.zip
drwxr-xr-x 11 es   es        4096 10月  6 16:52 zookeeper-3.4.10
-rw-r--r--  1 root root  35042811 10月  6 15:27 zookeeper-3.4.10.tar.gz
[es@topcheer mnt]$ cd elasticsearch-6.2.3/
[es@topcheer elasticsearch-6.2.3]$ ll
总用量 220
drwxr-xr-x  2 es es   4096 9月  21 22:49 bin
drwxr-xr-x  2 es es     75 9月  29 22:48 config
drwxrwxr-x  3 es es     19 9月  21 22:58 data
drwxr-xr-x  2 es es   4096 3月  13 2018 lib
-rw-r--r--  1 es es  11358 3月  13 2018 LICENSE.txt
drwxr-xr-x  2 es es    268 9月  29 22:44 logs
drwxr-xr-x 16 es es    289 3月  13 2018 modules
-rw-r--r--  1 es es 191887 3月  13 2018 NOTICE.txt
drwxr-xr-x  2 es es      6 3月  13 2018 plugins
-rw-r--r--  1 es es   9268 3月  13 2018 README.textile
[es@topcheer elasticsearch-6.2.3]$ ./bin/elasticsearch -d
2) 查看进程是否启动成功(等待一下)
[es@topcheer elasticsearch-6.2.3]$ lsof -i:9200 [es@topcheer elasticsearch-6.2.3]$ netstat -antp (Not all processes could be identified, non-owned process info will not be shown, you would have to be root to see it all.) Active Internet connections (servers and established) Proto Recv-Q Send-Q Local Address Foreign Address State PID/Program name tcp 0 0 0.0.0.0:111 0.0.0.0:* LISTEN - tcp 0 0 0.0.0.0:6000 0.0.0.0:* LISTEN - tcp 0 0 192.168.122.1:53 0.0.0.0:* LISTEN - tcp 0 0 0.0.0.0:22 0.0.0.0:* LISTEN - tcp 0 0 127.0.0.1:631 0.0.0.0:* LISTEN -