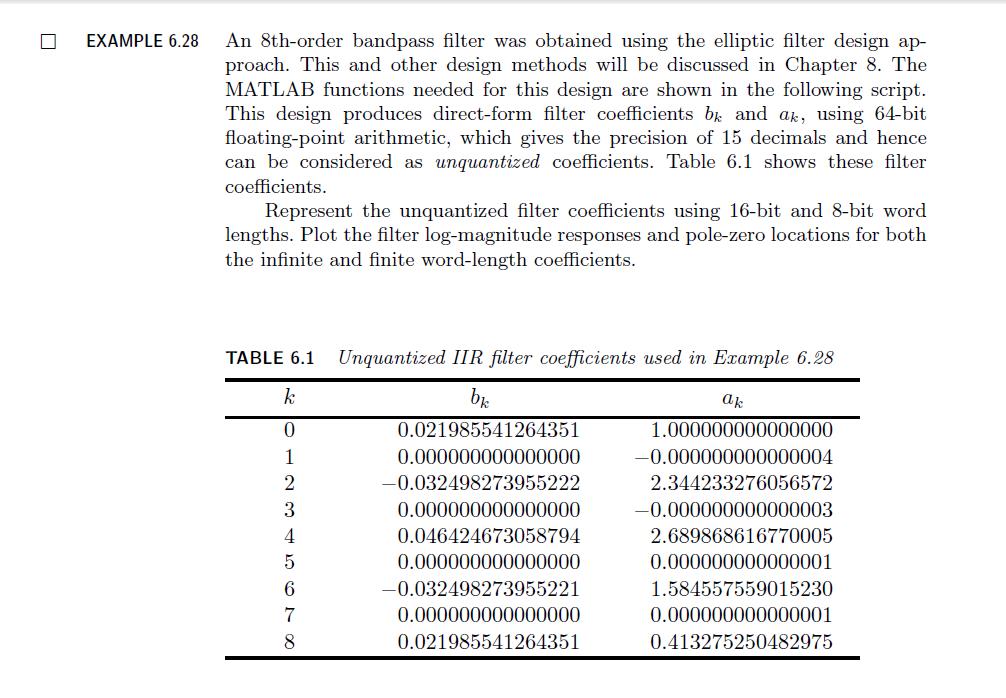
《DSP using MATLAB》示例Example 6.28
Posted 沧海一粟
tags:
篇首语:本文由小常识网(cha138.com)小编为大家整理,主要介绍了《DSP using MATLAB》示例Example 6.28相关的知识,希望对你有一定的参考价值。

代码:
% The following 3 lines produce filter coefficients shown in Table 6.1
wp = [0.35, 0.65]; ws = [0.25, 0.75]; Rp = 1; As = 50;
[N, wn] = ellipord(wp, ws, Rp, As);
[b, a] = ellip(N, Rp, As, wn);
w = [0:500]*pi/500; H = freqz(b, a, w);
magH = abs(H); magHdb = 20*log10(magH);

% 16-bit word-length quantization
N1 = 15; [bahat, L1, B1] = QCoeff([b; a], N1);
TITLE1 = sprintf(\'%i-bits (1+%i+%i) \', N1+1, L1, B1);
bhat1 = bahat(1, :); ahat1 = bahat(2, :);
Hhat1 = freqz(bhat1, ahat1, w); magHhat1 = abs(Hhat1);
magHhat1db = 20*log10(magHhat1); zhat1 = roots(bhat1);

% 8-bit word-length quantization
N2 = 7; [bahat, L2, B2] = QCoeff([b; a], N2);
TITLE2 = sprintf(\'%i-bits (1+%i+%i) \', N2+1, L2, B2);
bhat2 = bahat(1, :); ahat2 = bahat(2, :);
Hhat2 = freqz(bhat2, ahat2, w); magHhat2 = abs(Hhat2);
magHhat2db = 20*log10(magHhat2); zhat2 = roots(bhat2);

% Comparison of Magnitude Plots
Hf_1 = figure(\'paperunits\', \'inches\', \'paperposition\', [0, 0, 6, 5], \'NumberTitle\', \'off\', \'Name\', \'Exameple 6.28\');
%figure(\'NumberTitle\', \'off\', \'Name\', \'Exameple 6.26a\')
set(gcf,\'Color\',\'white\');

% Comparison of Log-Magnitude Response: 16 bits
subplot(2, 2, 1); plot(w/pi, magHdb, \'g\', \'linewidth\', 1.5); axis([0, 1, -80, 5]);
hold on; plot(w/pi, magHhat1db, \'r\', \'linewidth\', 1); hold off;
xlabel(\'Digital Frequency in \\pi units\', \'fontsize\', 10);
ylabel(\'Decibels\', \'fontsize\', 10); grid on;
title([\'Log-mag Plot: \', TITLE1], \'fontsize\', 10, \'fontweight\', \'bold\');

% Comparison of Pole-Zero Plots: 16 bits
subplot(2, 2, 3); [HZ, HP, Hl] = zplane([b], [a]); axis([-2, 2, -2, 2]); hold on;
set(HZ, \'color\', \'g\', \'linewidth\', 1, \'markersize\', 4);
set(HP, \'color\', \'g\', \'linewidth\', 1, \'markersize\', 4);
plot(real(zhat1), imag(zhat1), \'r+\', \'linewidth\', 1); grid on;
title([\'PZ Plot: \' TITLE1], \'fontsize\', 10, \'fontweight\', \'bold\'); hold off;

% Comparison of Log-Magnitude Response: 8 bits
subplot(2, 2, 2); plot(w/pi, magHdb, \'g\', \'linewidth\', 1.5); axis([0, 1, -80, 5]);
hold on; plot(w/pi, magHhat2db, \'r\', \'linewidth\', 1); hold off;
xlabel(\'Digital Frequency in \\pi units\', \'fontsize\', 10);
ylabel(\'Decibels\', \'fontsize\', 10); grid on;
title([\'Log-mag Plot: \', TITLE2], \'fontsize\', 10, \'fontweight\', \'bold\');

% Comparison of Pole-Zero Plots: 8 bits
subplot(2, 2, 4); [HZ, HP, Hl] = zplane([b], [a]); axis([-2, 2, -2, 2]); hold on;
set(HZ, \'color\', \'g\', \'linewidth\', 1, \'markersize\', 4);
set(HP, \'color\', \'g\', \'linewidth\', 1, \'markersize\', 4);
plot(real(zhat2), imag(zhat2), \'r+\', \'linewidth\', 1); grid on;
title([\'PZ Plot: \' TITLE2], \'fontsize\', 10, \'fontweight\', \'bold\'); hold off;
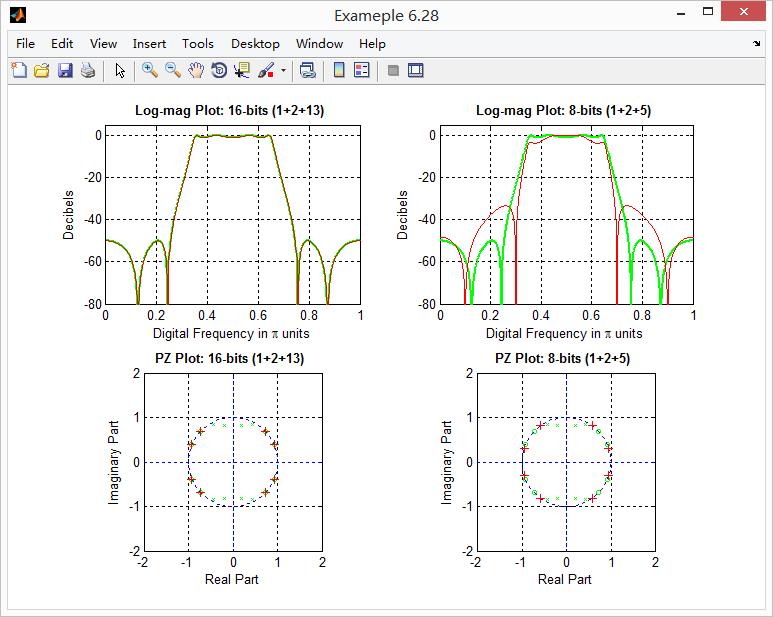
运行结果:

以上是关于《DSP using MATLAB》示例Example 6.28的主要内容,如果未能解决你的问题,请参考以下文章