MATLAB产生离散信号
Posted Vincent_Bryan
tags:
篇首语:本文由小常识网(cha138.com)小编为大家整理,主要介绍了MATLAB产生离散信号相关的知识,希望对你有一定的参考价值。
Matlab产生离散信号
常见离散信号
冲击信号
n = -5:5;
x = n == 0;% 当n为0时,x的值为1
stem(n, x, \'filled\');
axis([-5 5 0 1.1*max(x)]);%规定坐标轴的范围
xlabel(\'时间(n)\');ylabel(\'幅度(n)\');
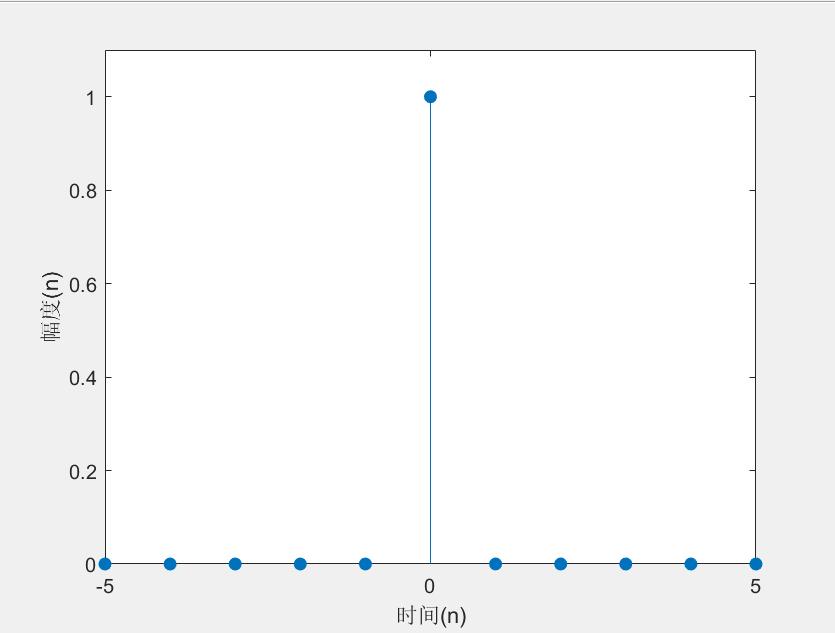
冲击信号
阶跃信号
n = -2:8;
x = n >= 0; % 当n大于等与零时,其值为1
stem(n, x, \'filled\');
axis([-4, 4, 0, 1.1*max(x)]);
title(\'阶跃信号\');
xlabel(\'时间(n)\');ylabel(\'幅度(n)\');
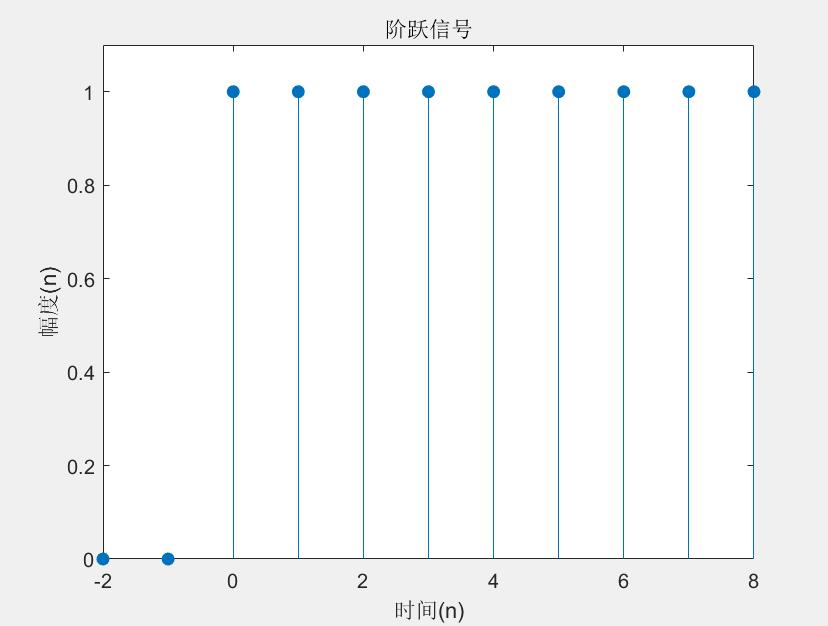
阶跃信号
实指数序列
n1=-10; n2=10;
a1=0.5; a2=2;
na1=n1:0;
x1 = a1.^na1;
na2 = 0:n2;
x2 = a2.^na2;
subplot(2,2,1);
plot(na1,x1);
title(\'实指数原信号(a<1)\');
subplot(2,2,3);
stem(na1,x1,\'filled\');
title(\'实指数序列(a<1)\');
subplot(2,2,2);
plot(na2,x2);
title(\'实指数原信号(a>1)\');
subplot(2,2,4);
stem(na2,x2,\'filled\');
title(\'实指数序列(a>1)\');
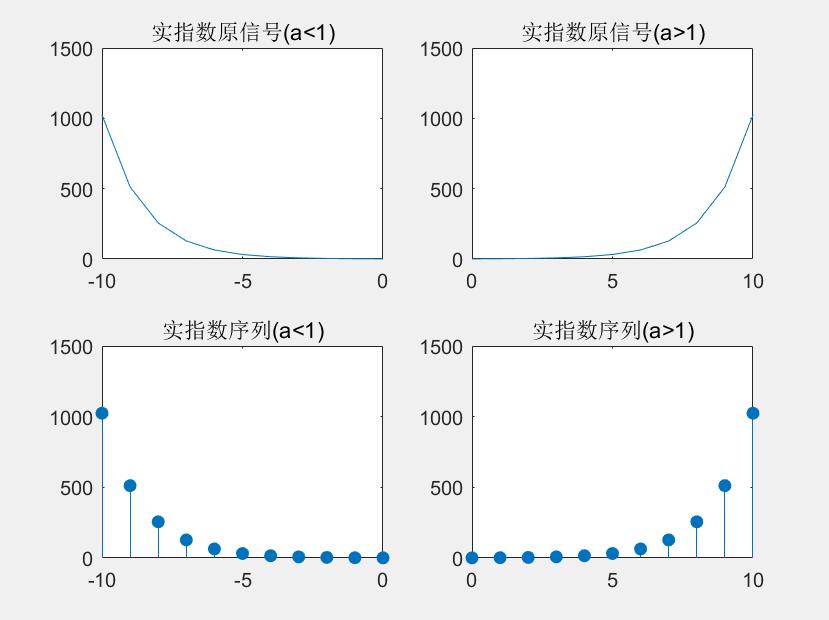
实数序列
复指数序列
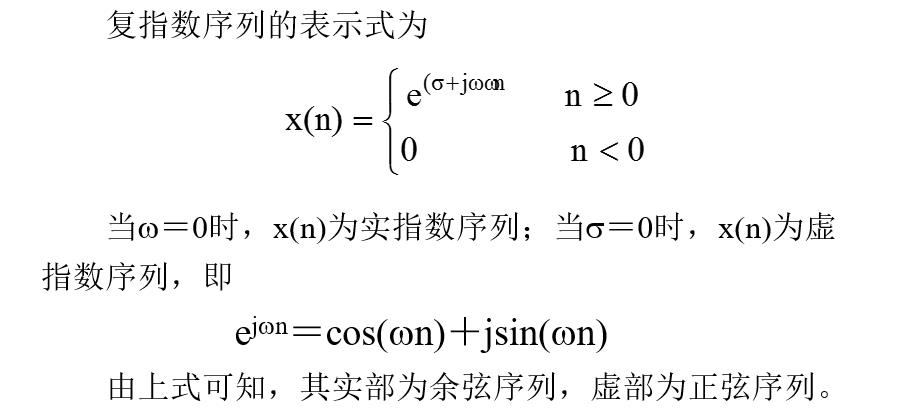
n = -10:0.2:10;
x = exp((-0.2+1j*0.6*pi)*n);
subplot(2,2,1), plot(n, real(x));% real画出实部
subplot(2,2,3), stem(n, real(x), \'filled\');
subplot(2,2,2), plot(n, imag(x)); % imag画出虚部
subplot(2,2,4), stem(n, imag(x), \'filled\');
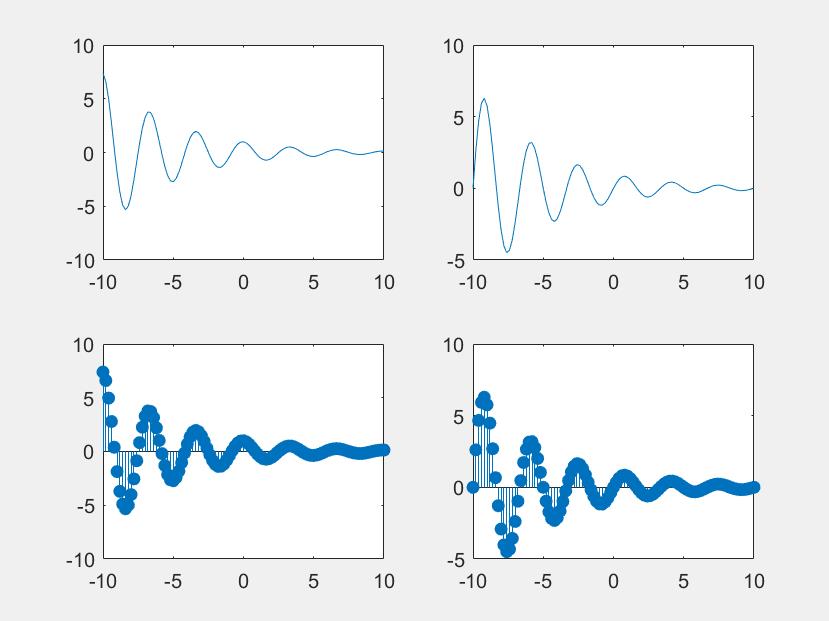
复指数信号
随机信号
tn=0:0.2:15;
N=length(tn);
x=rand(1,N);
subplot(2,1,1);
plot(tn,x);

tn=0:0.5:15;
N=length(tn);
y=rand(1,N);
subplot(2,1,2);
stem(tn,y);
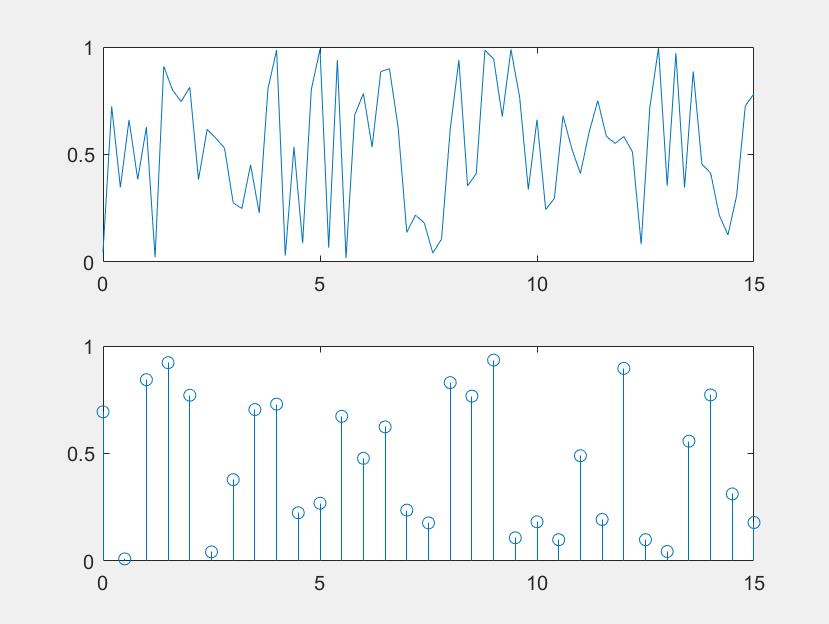
随机信号
以上是关于MATLAB产生离散信号的主要内容,如果未能解决你的问题,请参考以下文章