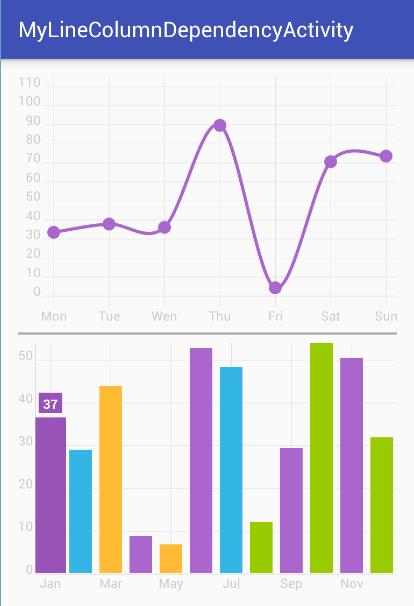
hellocharts折线图与柱状图的上下结合酷炫效果(学习笔记)
Posted 情似雨餘黏地絮
tags:
篇首语:本文由小常识网(cha138.com)小编为大家整理,主要介绍了hellocharts折线图与柱状图的上下结合酷炫效果(学习笔记)相关的知识,希望对你有一定的参考价值。
二话不说先贴图

贴代码:
LineColumnDependencyActivity.java
package com.shaoxin.mylinecolumndependencyactivity;

import android.os.Bundle;
import android.support.v4.app.Fragment;
import android.support.v7.app.ActionBarActivity;
import android.view.LayoutInflater;
import android.view.View;
import android.view.ViewGroup;

import java.util.ArrayList;
import java.util.List;

import lecho.lib.hellocharts.gesture.ZoomType;
import lecho.lib.hellocharts.listener.ColumnChartOnValueSelectListener;
import lecho.lib.hellocharts.model.Axis;
import lecho.lib.hellocharts.model.AxisValue;
import lecho.lib.hellocharts.model.Column;
import lecho.lib.hellocharts.model.ColumnChartData;
import lecho.lib.hellocharts.model.Line;
import lecho.lib.hellocharts.model.LineChartData;
import lecho.lib.hellocharts.model.PointValue;
import lecho.lib.hellocharts.model.SubcolumnValue;
import lecho.lib.hellocharts.model.Viewport;
import lecho.lib.hellocharts.util.ChartUtils;
import lecho.lib.hellocharts.view.ColumnChartView;
import lecho.lib.hellocharts.view.LineChartView;

public class LineColumnDependencyActivity extends ActionBarActivity {

    @Override
    protected void onCreate(Bundle savedInstanceState) {
        super.onCreate(savedInstanceState);
        setContentView(R.layout.activity_line_column_dependency);
        if (savedInstanceState == null) {
            getSupportFragmentManager().beginTransaction().add(R.id.container, new PlaceholderFragment()).commit();
        }
    }

    /**
     * A placeholder fragment containing a simple view.
     */
    public static class PlaceholderFragment extends Fragment {
        public final static String[] months = new String[]{"Jan", "Feb", "Mar", "Apr", "May", "Jun", "Jul", "Aug",
                "Sep", "Oct", "Nov", "Dec",};

        public final static String[] days = new String[]{"Mon", "Tue", "Wen", "Thu", "Fri", "Sat", "Sun",};

        private LineChartView chartTop;
        private ColumnChartView chartBottom;

        private LineChartData lineData;
        private ColumnChartData columnData;

        public PlaceholderFragment() {
        }

        @Override
        public View onCreateView(LayoutInflater inflater, ViewGroup container, Bundle savedInstanceState) {
            View rootView = inflater.inflate(R.layout.fragment_line_column_dependency, container, false);

            // *** TOP LINE CHART ***
            chartTop = (LineChartView) rootView.findViewById(R.id.chart_top);

            // Generate and set data for line chart
            generateInitialLineData();

            // *** BOTTOM COLUMN CHART ***

            chartBottom = (ColumnChartView) rootView.findViewById(R.id.chart_bottom);

            generateColumnData();

            return rootView;
        }

        private void generateColumnData() {

            int numSubcolumns = 1;
            int numColumns = months.length;

            List<AxisValue> axisValues = new ArrayList<AxisValue>();
            List<Column> columns = new ArrayList<Column>();
            List<SubcolumnValue> values;
            for (int i = 0; i < numColumns; ++i) {

                values = new ArrayList<SubcolumnValue>();
                for (int j = 0; j < numSubcolumns; ++j) {
                    values.add(new SubcolumnValue((float) Math.random() * 50f + 5, ChartUtils.pickColor()));
                }

                axisValues.add(new AxisValue(i).setLabel(months[i]));

                columns.add(new Column(values).setHasLabelsOnlyForSelected(true));
            }

            columnData = new ColumnChartData(columns);

            columnData.setAxisXBottom(new Axis(axisValues).setHasLines(true));
            columnData.setAxisYLeft(new Axis().setHasLines(true).setMaxLabelChars(2));

            chartBottom.setColumnChartData(columnData);

            // Set value touch listener that will trigger changes for chartTop.
            chartBottom.setOnValueTouchListener(new ValueTouchListener());

            // Set selection mode to keep selected month column highlighted.
            chartBottom.setValueSelectionEnabled(true);

            chartBottom.setZoomType(ZoomType.HORIZONTAL);

            // chartBottom.setOnClickListener(new View.OnClickListener() {
            //
            // @Override
            // public void onClick(View v) {
            // SelectedValue sv = chartBottom.getSelectedValue();
            // if (!sv.isSet()) {
            // generateInitialLineData();
            // }
            //
            // }
            // });

        }

        /**
         * Generates initial data for line chart. At the begining all Y values are equals 0. That will change when user
         * will select value on column chart.
         */
        private void generateInitialLineData() {
            int numValues = 7;

            List<AxisValue> axisValues = new ArrayList<AxisValue>();
            List<PointValue> values = new ArrayList<PointValue>();
            for (int i = 0; i < numValues; ++i) {
                values.add(new PointValue(i, 0));
                axisValues.add(new AxisValue(i).setLabel(days[i]));
            }

            Line line = new Line(values);
            line.setColor(ChartUtils.COLOR_GREEN).setCubic(true);

            List<Line> lines = new ArrayList<Line>();
            lines.add(line);

            lineData = new LineChartData(lines);
            lineData.setAxisXBottom(new Axis(axisValues).setHasLines(true));
            lineData.setAxisYLeft(new Axis().setHasLines(true).setMaxLabelChars(3));

            chartTop.setLineChartData(lineData);

            // For build-up animation you have to disable viewport recalculation.
            chartTop.setViewportCalculationEnabled(false);

            // And set initial max viewport and current viewport- remember to set viewports after data.
            Viewport v = new Viewport(0, 110, 6, 0);
            chartTop.setMaximumViewport(v);
            chartTop.setCurrentViewport(v);

            chartTop.setZoomType(ZoomType.HORIZONTAL);
        }

        private void generateLineData(int color, float range) {
            // Cancel last animation if not finished.
            chartTop.cancelDataAnimation();

            // Modify data targets
            Line line = lineData.getLines().get(0);// For this example there is always only one line.
            line.setColor(color);
            for (PointValue value : line.getValues()) {
                // Change target only for Y value.
                value.setTarget(value.getX(), (float) Math.random() * range);
            }

            // Start new data animation with 300ms duration;
            chartTop.startDataAnimation(300);
        }

        private class ValueTouchListener implements ColumnChartOnValueSelectListener {

            @Override
            public void onValueSelected(int columnIndex, int subcolumnIndex, SubcolumnValue value) {
                generateLineData(value.getColor(), 100);
            }

            @Override
            public void onValueDeselected() {

                generateLineData(ChartUtils.COLOR_GREEN, 0);

            }
        }
    }
}
activity_line_column_dependency.xml
<FrameLayout xmlns:android="http://schemas.android.com/apk/res/android"
    xmlns:tools="http://schemas.android.com/tools"
    android:id="@+id/container"
    android:layout_width="match_parent"
    android:layout_height="match_parent"
   tools:ignore="MergeRootFrame" />
fragment_line_column_dependency.xml
<LinearLayout xmlns:android="http://schemas.android.com/apk/res/android"
    xmlns:tools="http://schemas.android.com/tools"
    android:layout_width="match_parent"
    android:layout_height="match_parent"
    android:orientation="vertical"
    android:paddingBottom="@dimen/activity_vertical_margin"
    android:paddingLeft="@dimen/activity_horizontal_margin"
    android:paddingRight="@dimen/activity_horizontal_margin"
    android:paddingTop="@dimen/activity_vertical_margin"
   >

    <lecho.lib.hellocharts.view.LineChartView
        android:id="@+id/chart_top"
        android:layout_width="match_parent"
        android:layout_height="0dp"
        android:layout_weight="1" >
    </lecho.lib.hellocharts.view.LineChartView>

    <View
        android:layout_width="match_parent"
        android:layout_height="2dp"
        android:layout_marginBottom="8dp"
        android:layout_marginTop="8dp"
        android:background="@android:color/darker_gray" />

    <lecho.lib.hellocharts.view.ColumnChartView
        android:id="@+id/chart_bottom"
        android:layout_width="match_parent"
        android:layout_height="0dp"
        android:layout_weight="1" >
    </lecho.lib.hellocharts.view.ColumnChartView>

</LinearLayout>
觉得好的别忘了评论点赞
以上是关于hellocharts折线图与柱状图的上下结合酷炫效果(学习笔记)的主要内容,如果未能解决你的问题,请参考以下文章