ELK之topbeat部署
Posted Keep Moving
tags:
篇首语:本文由小常识网(cha138.com)小编为大家整理,主要介绍了ELK之topbeat部署相关的知识,希望对你有一定的参考价值。
topbeat定期收集系统信息如每个进程信息、负载、内存、磁盘等等,然后将数据发送到elasticsearch进行索引,最后通过kibana进行展示。
下面是具体的安装及配置步骤:
1、安装topbeat
$ tar zxf topbeat-1.3.1-x86_64.tar.gz
$ mv topbeat-1.3.1 topbeat
2、配置topbeat
$ vim topbeat/topbeat.yml #修改如下内容
input:
  # In seconds, defines how often to read server statistics
  period: 10

  # Regular expression to match the processes that are monitored
  # By default, all the processes are monitored
  procs: [".*"]

  # Statistics to collect (all enabled by default)
  stats:
    # per system statistics, by default is true
    system: true

    # per process statistics, by default is true
    process: true

    # file system information, by default is true
    filesystem: true

    # cpu usage per core, by default is false
    cpu_per_core: true

output:

  ### Elasticsearch as output
  elasticsearch:
    hosts: ["ip:9200"]
3、配置elasticsearch模板
$ curl -XPUT \'http://ip:9200/_template/topbeat\' -d@/data/elk/topbeat/topbeat.template.json
4、启动topbeat
$ cd topbeat/
$ nohup ./topbeat &
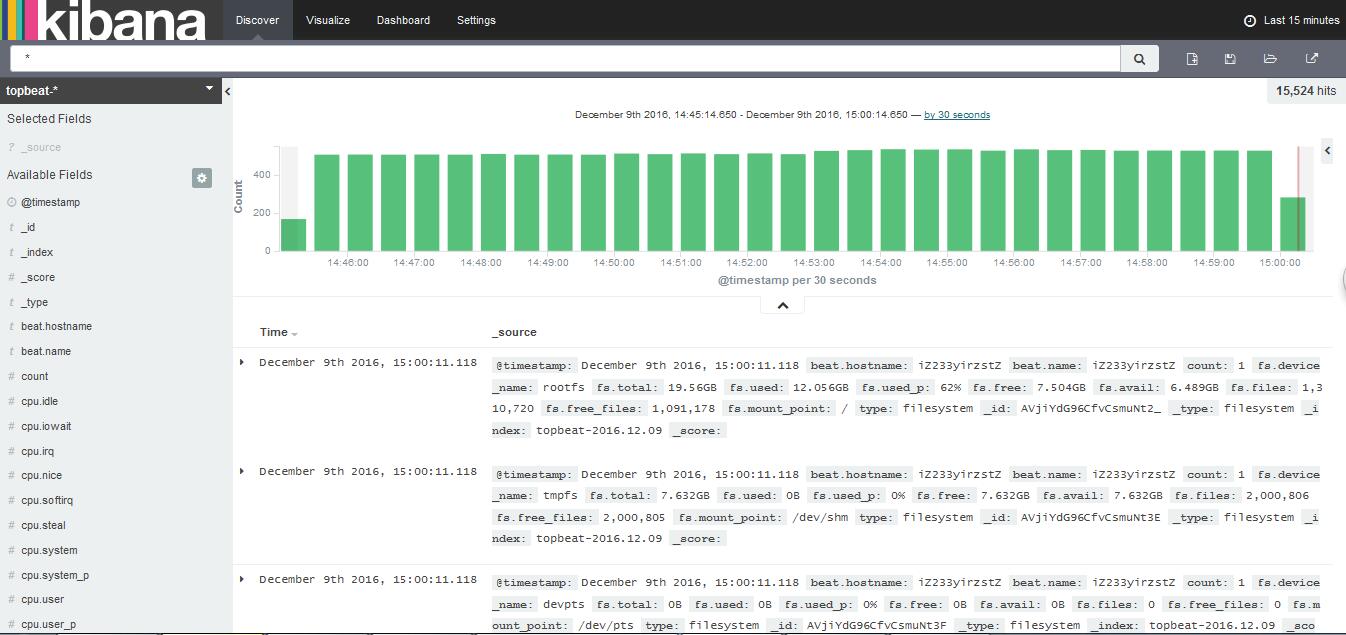
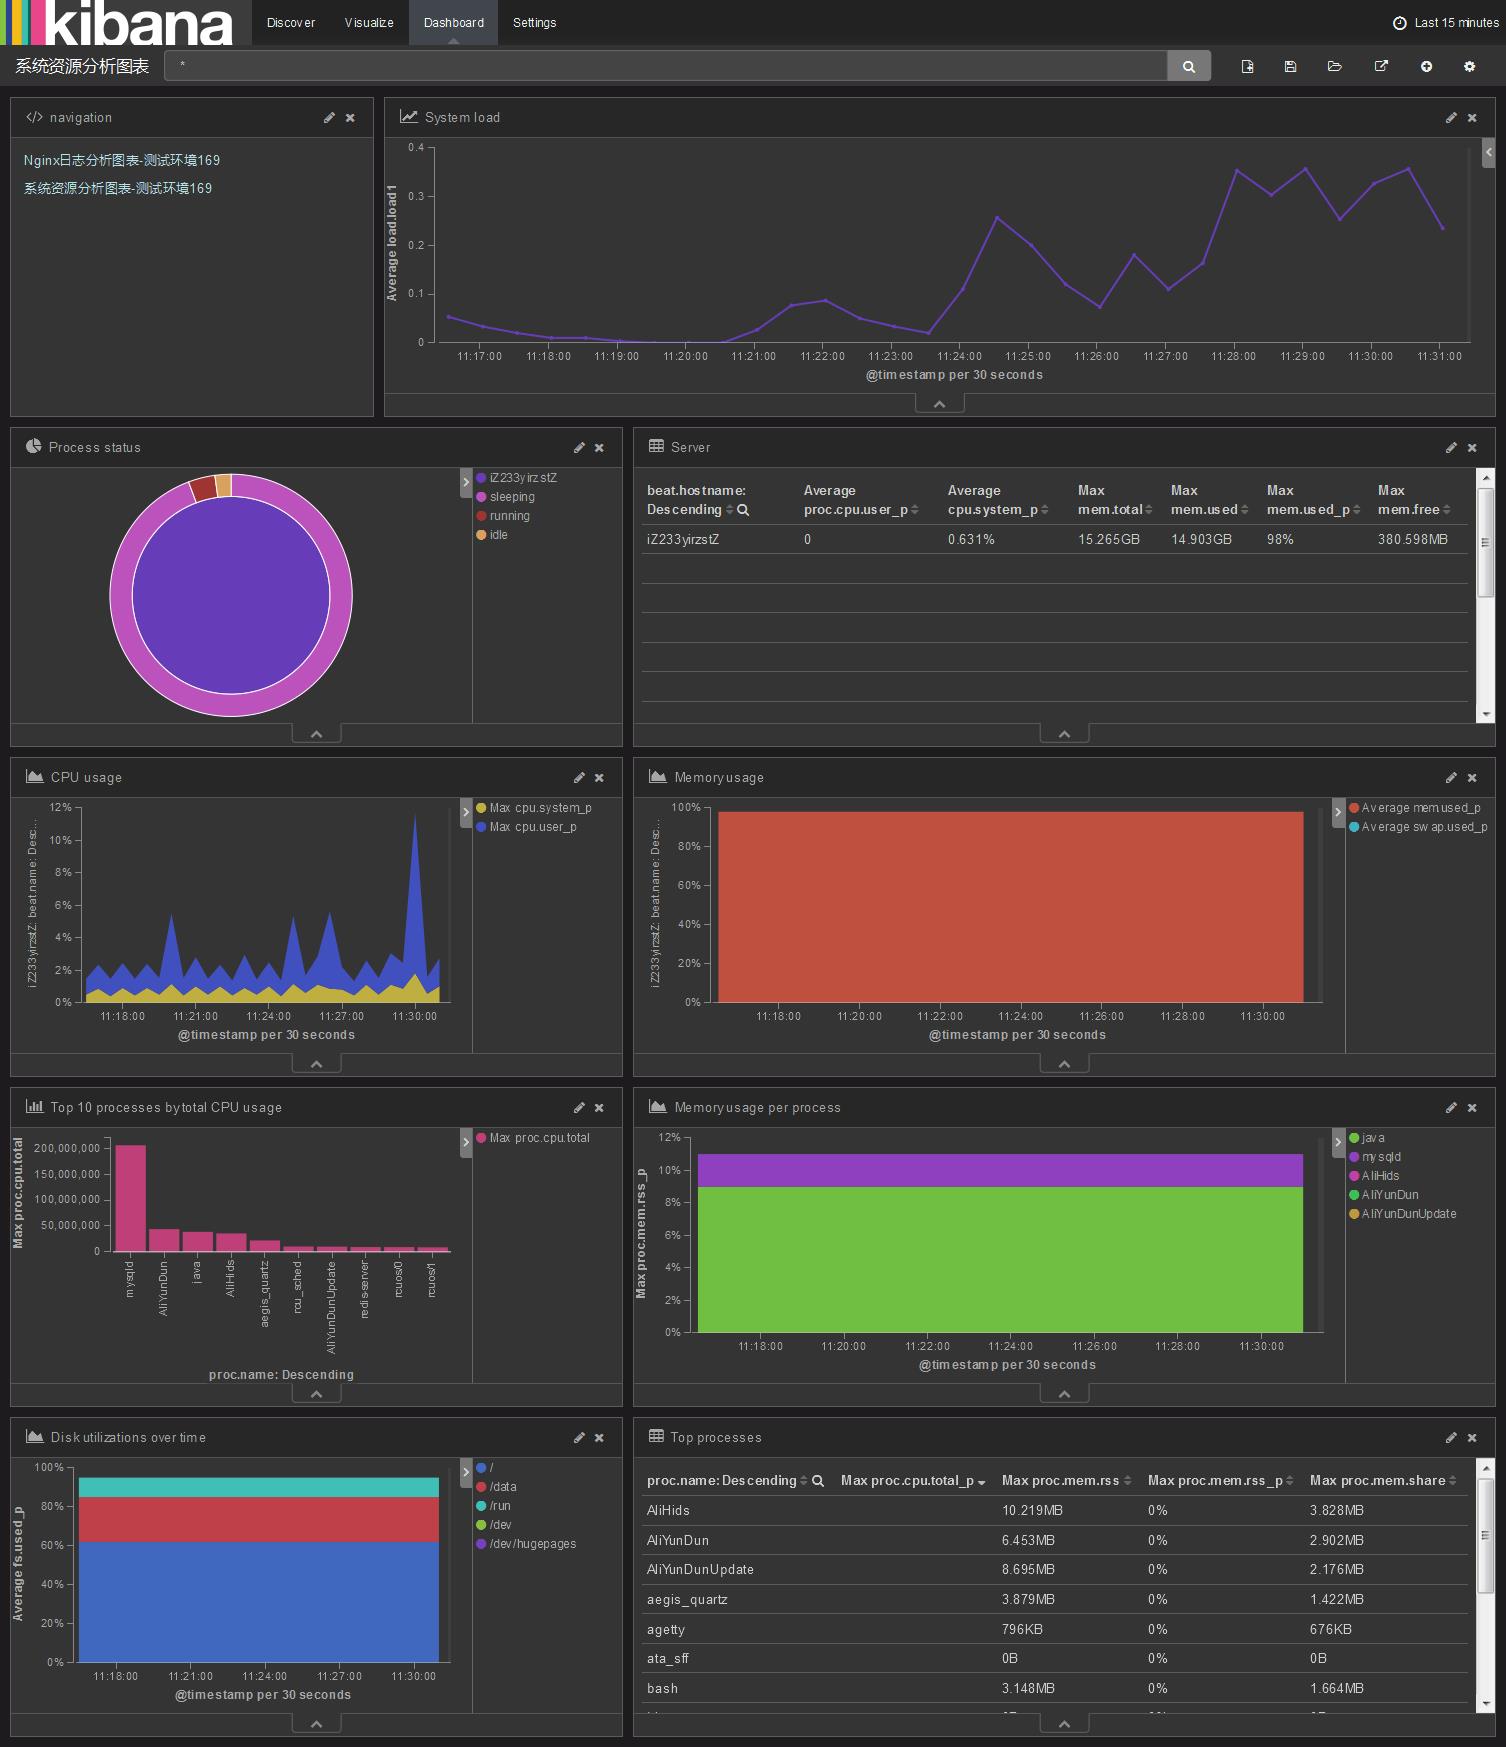
最后看一下在Kibana中的数据及图表展示:
以上是关于ELK之topbeat部署的主要内容,如果未能解决你的问题,请参考以下文章