ECharts(Enterprise Charts 商业产品图表库)初识
Posted 葉子。
tags:
篇首语:本文由小常识网(cha138.com)小编为大家整理,主要介绍了ECharts(Enterprise Charts 商业产品图表库)初识相关的知识,希望对你有一定的参考价值。
一、简介
大数据时代,重新定义图表的时候到了,所以随之ECharts就随之出现了。
ECharts(Enterprise Charts 商业产品图表库) 是基于Canvas的,纯javascript 的图表库,提供直观,生动,可交互,可个性化定制的
数据可视化图表。创新的拖拽重计算、数据视图、值域漫游等特性大大增强了用户体验,赋予了用户对数据进行挖掘、整合的能力。
ECharts 是指 Enterprise Charts(商业产品图表库),提供商业产品常用图表库,底层基于 ZRender,创建了坐标系,图例,提示,工
具箱等基础组件,并在此上构建出折线图(区域图)、柱状图(条状图)、散点图(气泡图)、K线图、饼图(环形图)、地图、力导向布局
图,同时支持任意维度的堆积和多图表混合展现。
二、简单的例子介入学习
需要导入jar
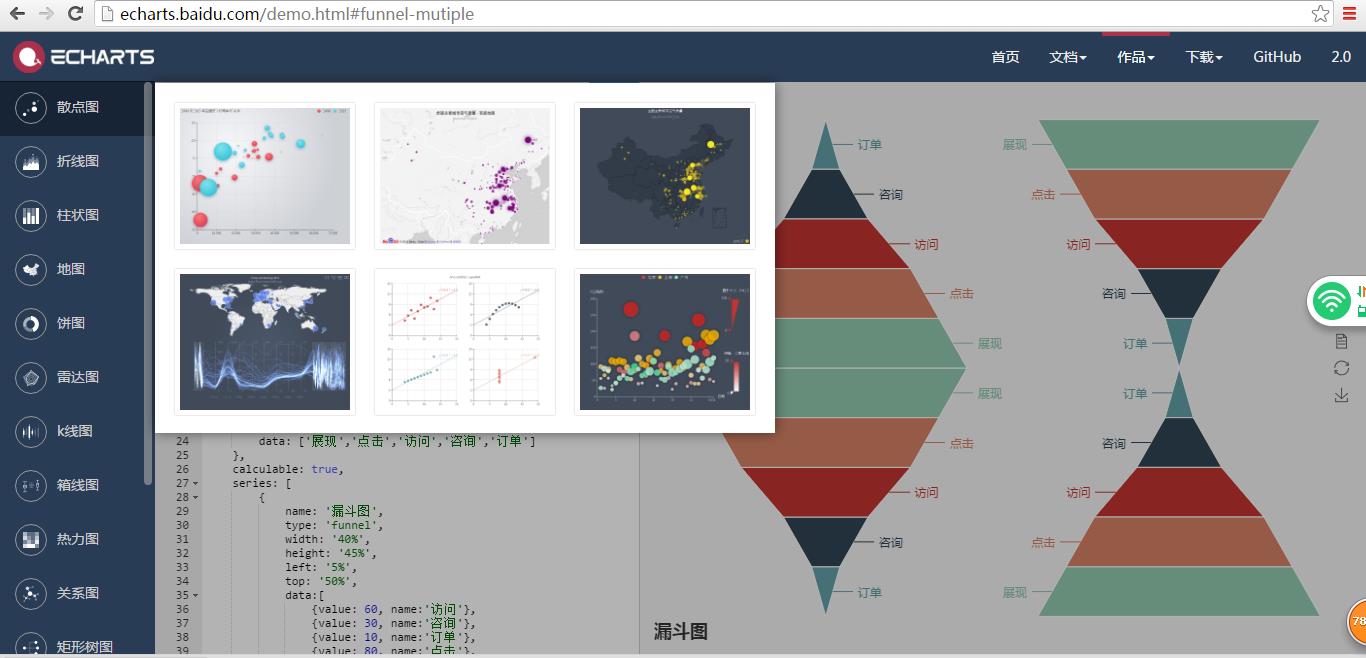
学习方法:http://echarts.baidu.com/官网
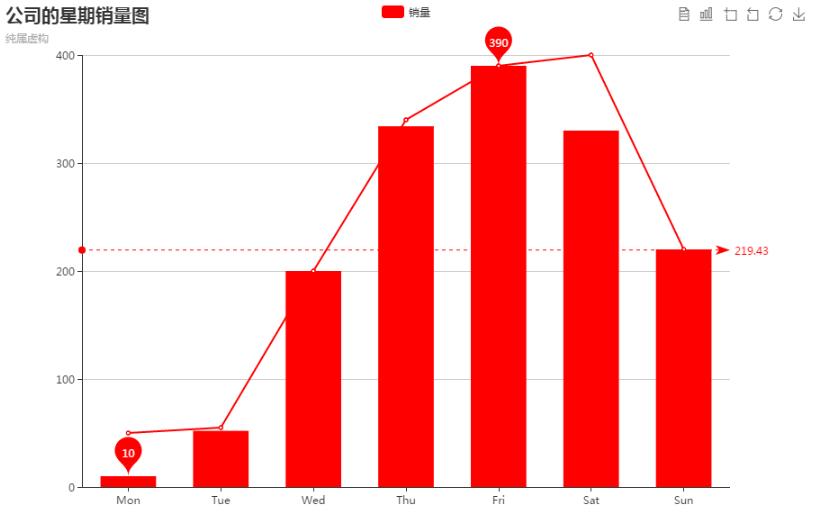
柱状图页面展示

三、如上图所示简单的jsp页面访问(根据帮助文档查看属性)-----需要一个ehcache-1.2.3.jar
<%@ page language="java" import="java.util.*" pageEncoding="utf-8"%>
<%
    String path = request.getContextPath();
    String basePath = request.getScheme() + "://"
            + request.getServerName() + ":" + request.getServerPort()
            + path + "/";
%>

<!DOCTYPE html PUBLIC "-//W3C//DTD HTML 4.01 Transitional//EN">
<html>
<head>
<base href="<%=basePath%>">

<title>柱状图</title>
<!-- 引入echarts.js -->
<script type="text/javascript" src="<%=path%>/js/echarts.js"></script>
</head>
<body>
    <!--为ECharts准备一个具有大小的Dom-->
    <div id="main" style="width: 900px;height: 600px"></div>
</body>
<script type="text/javascript">
    //基于准备好的dom,初始化echarts实例
    var myChart = echarts.init(document.getElementById("main"));
    var option = {
        //标题组件
        title : {
            text : \'公司的星期销量图\',
            subtext : \'纯属虚构\',
            left : \'left\',
            textStyle : {
                fontSize : 20
            },
        },
        //图例
        legend : {
            data : [ \'销量\' ]
        },
        //颜色
        color : [ \'red\' ],
        //提示框组件
        tooltip : {
            trigger : \'axis\',
            axisPointer : { // 坐标轴指示器,坐标轴触发有效
                type : \'shadow\' // 默认为直线,可选为:\'line\' | \'shadow\'|\'cross\'
            }
        },
        //工具栏
        toolbox : {
            show : true,//是否显示
            feature : {
                //数据视图工具,可以展现当前图表所用的数据,编辑后可以动态更新。
                dataView : {
                    show : true,
                    readOnly : false
                },
                //动态类型切换
                magicType : {
                    show : true,
                    type : [ \'pie\', \'bar\' ]
                },
                dataZoom:
                {
                 show:true
                },
                //配置项还原
                restore : {
                    show : true
                },
                //保存为图片
                saveAsImage : {
                    show : true
                }
            }
        },
        //x轴
        xAxis : [ {
            position : \'bottom\',//x 轴的位置。可选:\'top\',\'bottom\'
            type : \'category\',
            data : [ \'Mon\', \'Tue\', \'Wed\', \'Thu\', \'Fri\', \'Sat\', \'Sun\' ],
            axisTick : {
                alignWithLabel : true
            }
        } ],
        //y轴
        yAxis : [ {
            type : \'value\'
        } ],
        //系列列表
        series : [ {
            name : \'销量\',
            type : \'bar\',
            barWidth : \'60%\',
            data : [ 10, 52, 200, 334, 390, 330, 220 ],
            //图表标注
            markPoint : {
                data : [ {
                    type : \'max\',
                    name : \'最大值\'
                }, {
                    type : \'min\',
                    name : \'最小值\'
                } ]
            },
            //图表标线
            markLine : {
                data : [ {
                    type : \'average\',
                    name : \'平均值\'
                } ]
            }
        }, {
            name : \'产量\',
            type : \'line\',
            data : [ 50, 55, 200, 340, 390, 400, 220 ]
        } ],

    };
    //使用个刚指定的配置项和数据显示图表
    myChart.setOption(option);
</script>
</html>
剩下的可以在帮助文档的视图展示找自己需要的代码

以上是关于ECharts(Enterprise Charts 商业产品图表库)初识的主要内容,如果未能解决你的问题,请参考以下文章