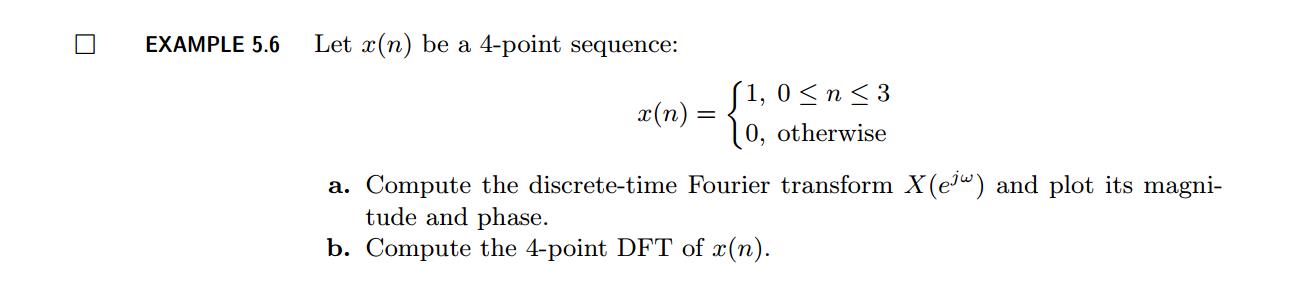
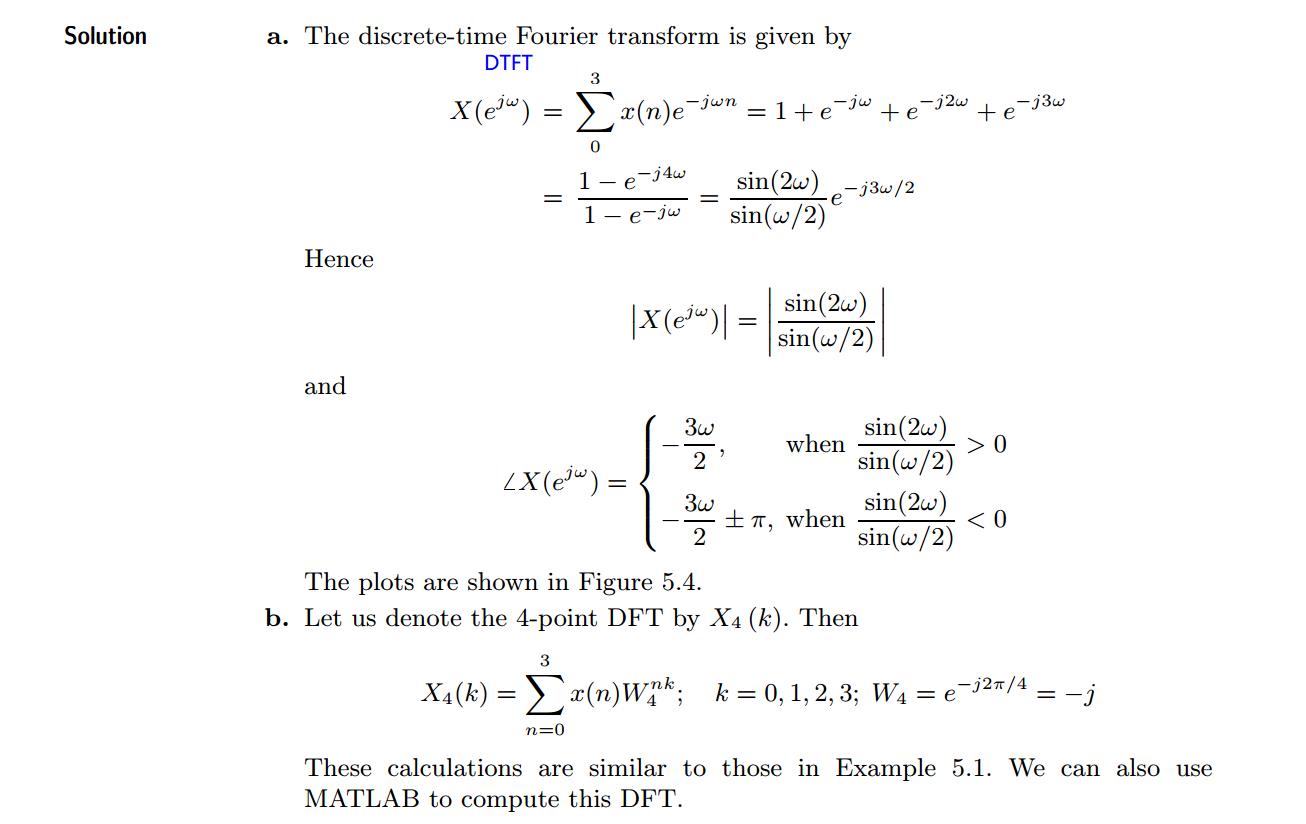
《DSP using MATLAB》示例Example5.6
Posted 沧海一粟
tags:
篇首语:本文由小常识网(cha138.com)小编为大家整理,主要介绍了《DSP using MATLAB》示例Example5.6相关的知识,希望对你有一定的参考价值。
代码:
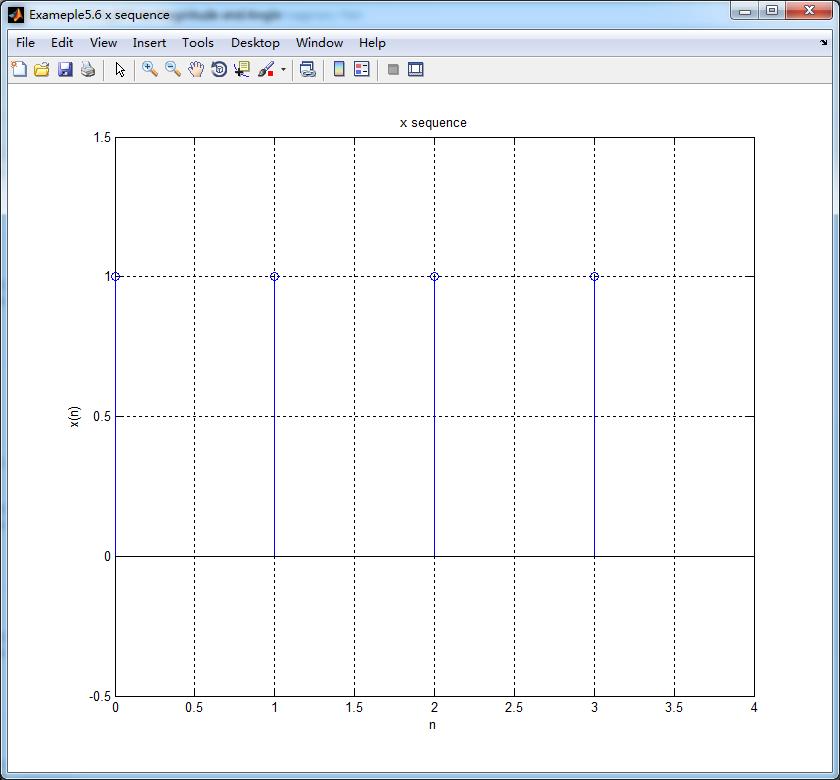
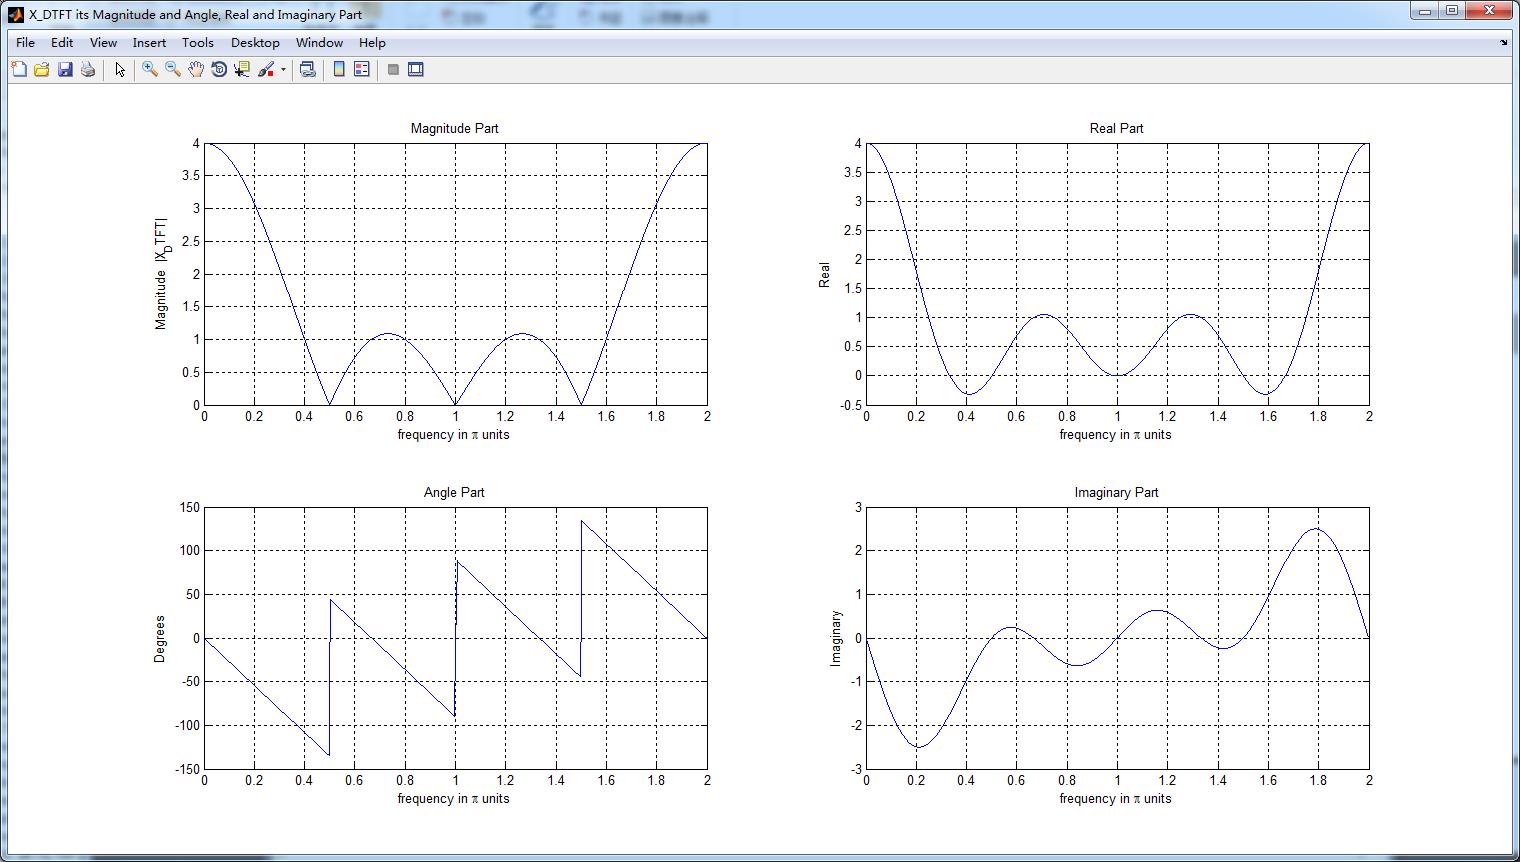
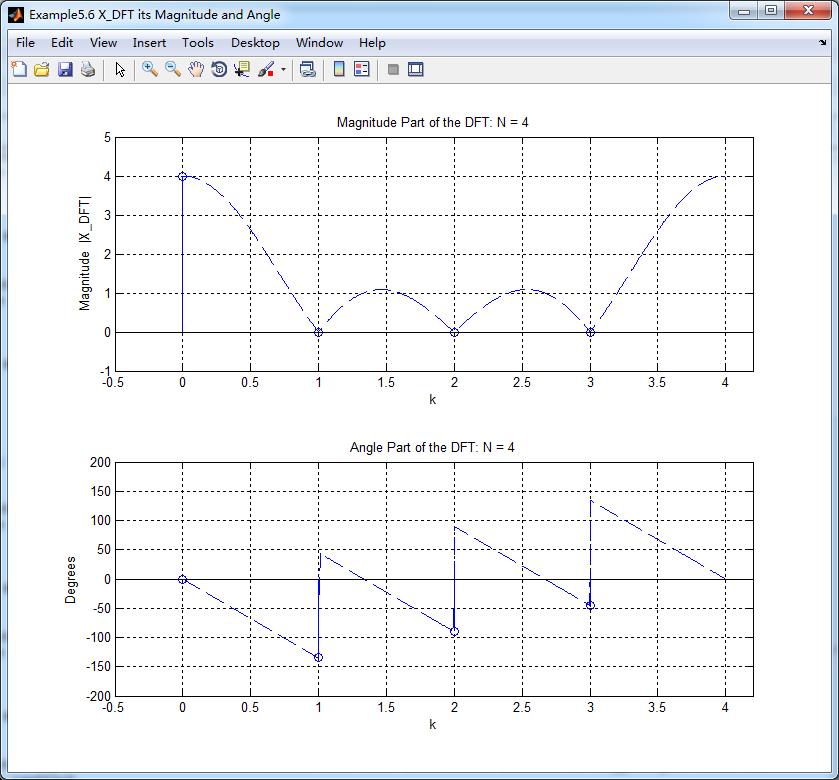
x = [1, 1, 1, 1]; N = 4;
X_DFT = dft(x,N);                                      % DFT of x(n)

magX_DFT = abs(X_DFT), phaX_DFT = angle(X_DFT)*180/pi; realX_DFT = real(X_DFT); imagX_DFT = imag(X_DFT);
angX_DFT = angle(X_DFT);

n = 0:(N - 1);
k = 0:1000; w = (pi/500)*k;                            % [0,2pi] axis divided into 501 points.
%k = 0:500; w = (pi/500)*k;                            % [0,pi] axis divided into 501 points.
X_DTFT = x * (exp(-j*pi/500)) .^ (n\'*k);               % DTFT of x(n)

magX_DTFT = abs(X_DTFT); angX_DTFT = angle(X_DTFT); realX_DTFT = real(X_DTFT); imagX_DTFT = imag(X_DTFT);

figure(\'NumberTitle\', \'off\', \'Name\', \'Exameple5.6 x sequence\')
set(gcf,\'Color\',\'white\');
stem(n,x); title(\'x sequence\'); axis([0,4,-0.5,1.5]);
xlabel(\'n\'); ylabel(\'x(n)\'); grid on;


%% --------------------------------------------------------------
%%        START X_DTFT\'s  mag ang real imag
%% --------------------------------------------------------------
figure(\'NumberTitle\', \'off\', \'Name\', \'X_DTFT its Magnitude and Angle, Real and Imaginary Part\');
set(gcf,\'Color\',\'white\');
subplot(2,2,1); plot(w/pi,magX_DTFT); grid on;  % axis([-2,2,0,15]);
title(\'Magnitude Part\');
xlabel(\'frequency in \\pi units\'); ylabel(\'Magnitude  |X\\_DTFT|\');
subplot(2,2,3); plot(w/pi, angX_DTFT*180/pi); grid on;  % axis([-2,2,-1,1]);
title(\'Angle Part\');
xlabel(\'frequency in \\pi units\'); ylabel(\'Degrees\'); %axis([-200,200,0,2]);

subplot(\'2,2,2\'); plot(w/pi, realX_DTFT); grid on;
title(\'Real Part\');
xlabel(\'frequency in \\pi units\'); ylabel(\'Real\');
subplot(\'2,2,4\'); plot(w/pi, imagX_DTFT); grid on;
title(\'Imaginary Part\');
xlabel(\'frequency in \\pi units\'); ylabel(\'Imaginary\');
%% --------------------------------------------------------------
%%        END X_DTFT\'s  mag ang real imag
%% --------------------------------------------------------------


%% --------------------------------------------------------------
%%        START X_DFT\'s  mag ang real imag
%% --------------------------------------------------------------
figure(\'NumberTitle\', \'off\', \'Name\', \'Example5.6 X_DFT its Magnitude and Angle\');
set(gcf,\'Color\',\'white\');
subplot(2,1,1); stem(n,magX_DFT); hold on; plot(2*w/pi,magX_DTFT,\'--\'); hold off;
grid on;   axis([-0.5,4.2,-1,5]);
title(\'Magnitude Part of the DFT: N = 4\');
xlabel(\'k\'); ylabel(\'Magnitude  |X\\_DFT|\');
subplot(2,1,2); stem(n, phaX_DFT); hold on; plot(2*w/pi,angX_DTFT*180/pi,\'--\'); hold off;
grid on;   axis([-0.5,4.2,-200,200]);
title(\'Angle Part of the DFT: N = 4\');
xlabel(\'k\'); ylabel(\'Degrees\'); %axis([-200,200,0,2]);

%subplot(\'2,2,2\'); stem(n, realX_DFT); grid on;
%title(\'Real Part\');
%xlabel(\'frequency in \\pi units\'); ylabel(\'Real\');
%subplot(\'2,2,4\'); stem(n, imagX_DFT); grid on;
%title(\'Imaginary Part\');
%xlabel(\'frequency in \\pi units\'); ylabel(\'Imaginary\');
%% --------------------------------------------------------------
%%        END X_DFT\'s  mag ang real imag
%% --------------------------------------------------------------
运行结果:


以上是关于《DSP using MATLAB》示例Example5.6的主要内容,如果未能解决你的问题,请参考以下文章