在vue中 echarts 柱状图调后台接口
Posted
tags:
篇首语:本文由小常识网(cha138.com)小编为大家整理,主要介绍了在vue中 echarts 柱状图调后台接口相关的知识,希望对你有一定的参考价值。
参考技术A 1.安装echarts依赖
npm install echarts -S 或cnpm install echarts -S
2.全局引用
// main.js引入echarts
import echarts from \'echarts\' //有时语法报错 或使用 import * as echarts from \'echarts\'
Vue.prototype.$echarts = echarts
3.创建组件
<template>
<div id="echarts">
<div >
<div>
<div id="myChart" :style=" width: \'600px\', height: \'300px\' "></div>
</div>
</div>
</div>
</template>
<script>
import * as echarts from \'echarts\'
import getarrival from \'@/api/product\' //调用后台接口
export default
name: \'Echarts\',
data()
return
dataList: [],
obj:
id:1
,
mounted()
this.drawLine()
,
methods:
drawLine()
getarrival(this.obj).then((res) =>
this.dataList = res.data.data.arrivel_later_result.bar //接口返回数据赋值this.dataList
// 基于准备好的dom,初始化echarts实例
let myChart = echarts.init(document.getElementById(\'myChart\'))
// 绘制图表
myChart.setOption(
title:
text: this.dataList.title.text,
subtext: this.dataList.title.subtext,
left: this.dataList.title.left
,
grid:
left: \'3%\',
right: \'4%\',
bottom: \'3%\',
containLabel: true
,
tooltip:
trigger: \'axis\',
axisPointer:
type: \'shadow\'
,
xAxis:
type: \'category\',
data: this.dataList.xAxis.data
,
yAxis:
type: \'value\'
// boundaryGap: [0, 0.01]
,
series: [
name: \'迟到占比\',
type: \'bar\',
barWidth: 30, //柱图宽度
data: this.dataList.series[0].data
]
)
)
,
</script>
<style scoped>
</style>
4.效果实现
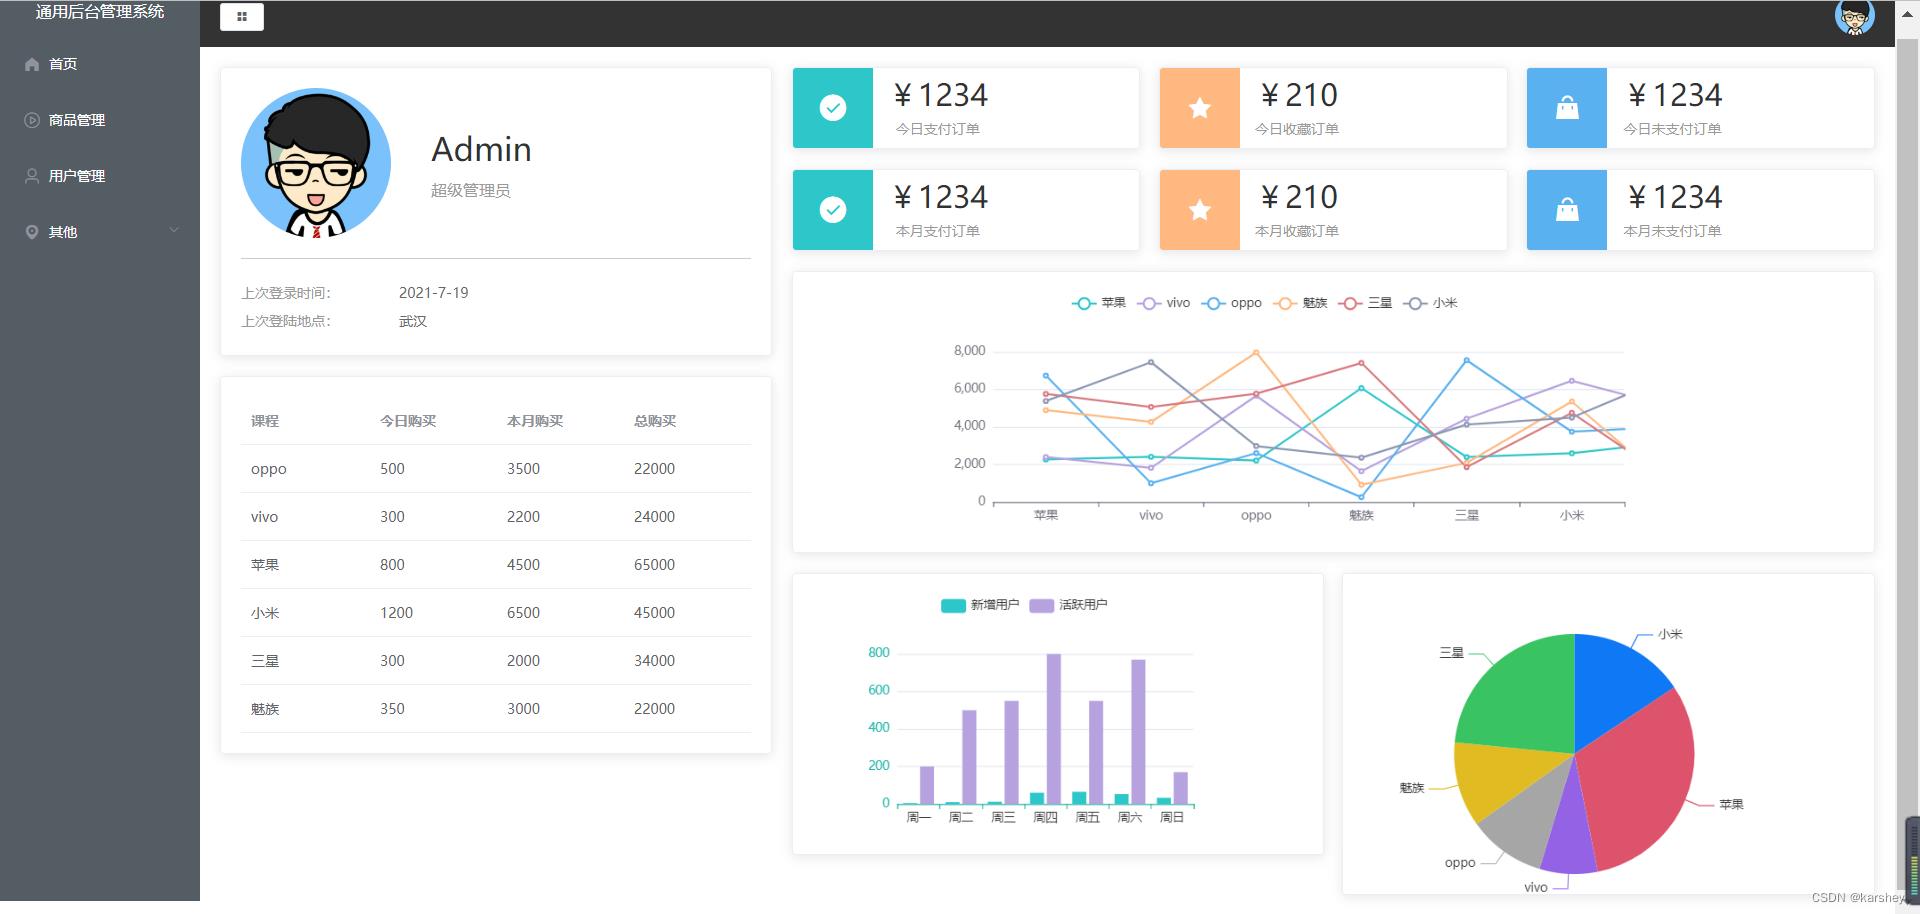
前端Vue+Element UI案例:通用后台管理系统-Echarts图表:折线图柱状图饼状图
文章目录
上一篇:【前端】Vue+Element UI案例:通用后台管理系统-Echarts图表准备:axios封装、mock数据模拟实战
目标

- 左边:把代码中写死的数据改成mock模拟的数据
- 右边三个图:折线图,柱状图,饼状图
代码
数据改写为动态
上一篇中我们在mockData中有一个tableData,就是它了!

export default
    data()
        return
            TableData:[],
            TableLabel,
            CountData

    ,
    mounted()
        getData().then((data)=>
            console.log(data);
            this.TableData=data.data.getStatisticalData.data.tableData
        )
效果:

Echarts引入与html结构
文档:echarts文档
安装:
npm i echarts@5.1.2
引入:
import * as echarts from 'echarts'
html结构:
- 三个图标都是卡片,所以都在
el-card里 - 用ref引入echarts图表,且里面一定要有height或width,否则不显示
- 注意向左的间距
- 柱状图和饼状图的横向排列:
flex+space between
<!-- echarts图表 -->
<div style="margin-left:20px">
   <!-- 折线图 -->
   <el-card style="height:280px">
       <div ref="echarts1" style="height:280px"></div>
   </el-card>
   <div class="graph">
       <!-- 柱状图 -->
       <el-card style="height:260px">
           <div ref="echarts2" style="height:260px"></div>
       </el-card>
       <!-- 饼状图 -->
       <el-card style="height:260px">
           <div ref="echarts3" style="height:260px"></div>
       </el-card>
   </div>
</div>
css:
.graph
    display: flex;
    // 两个靠边
    justify-content: space-between;
    margin-top: 20px;

    .el-card
        width: 49%;
效果:就是这样~

折线图:orderData
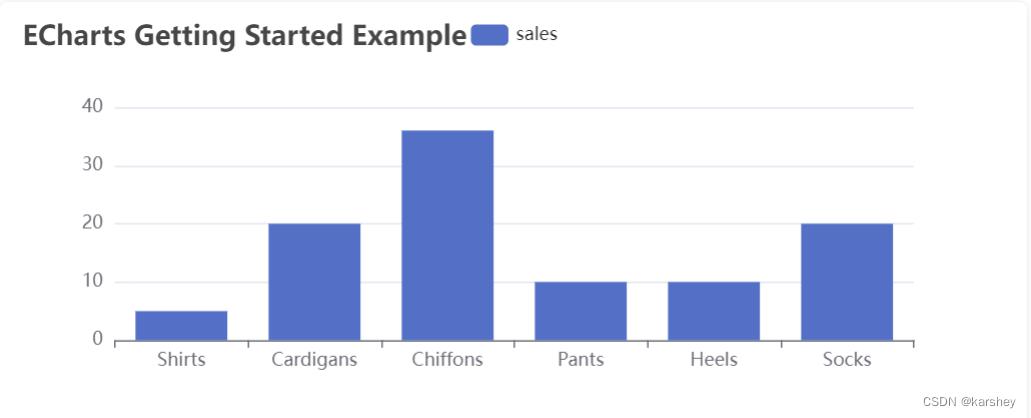
文档中模板的代码如下:虽然模板的代码是柱状图,而我们这里要做的事折线图,但我们可以通过模板来了解配置与其对应的效果。
// 基于准备好的dom,初始化echarts实例
var myChart = echarts.init(document.getElementById('main'));

// 指定图表的配置项和数据
var option =
  title:
    text: 'ECharts 入门示例'
  ,
  tooltip: ,
  legend:
    data: ['销量']
  ,
  xAxis:
    data: ['衬衫', '羊毛衫', '雪纺衫', '裤子', '高跟鞋', '袜子']
  ,
  yAxis: ,
  series: [

      name: '销量',
      type: 'bar',
      data: [5, 20, 36, 10, 10, 20]

  ]
;

// 使用刚指定的配置项和数据显示图表。
myChart.setOption(option);
效果如下 :
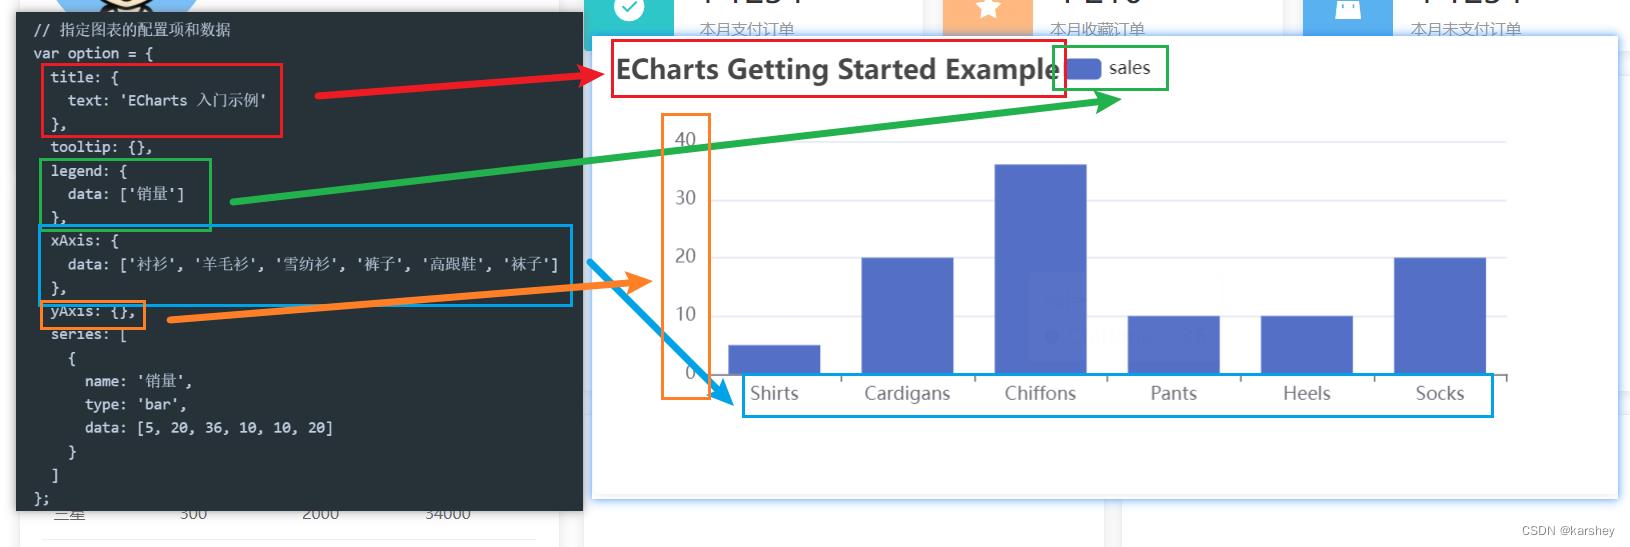
配置关系如下:具体可以看文档。
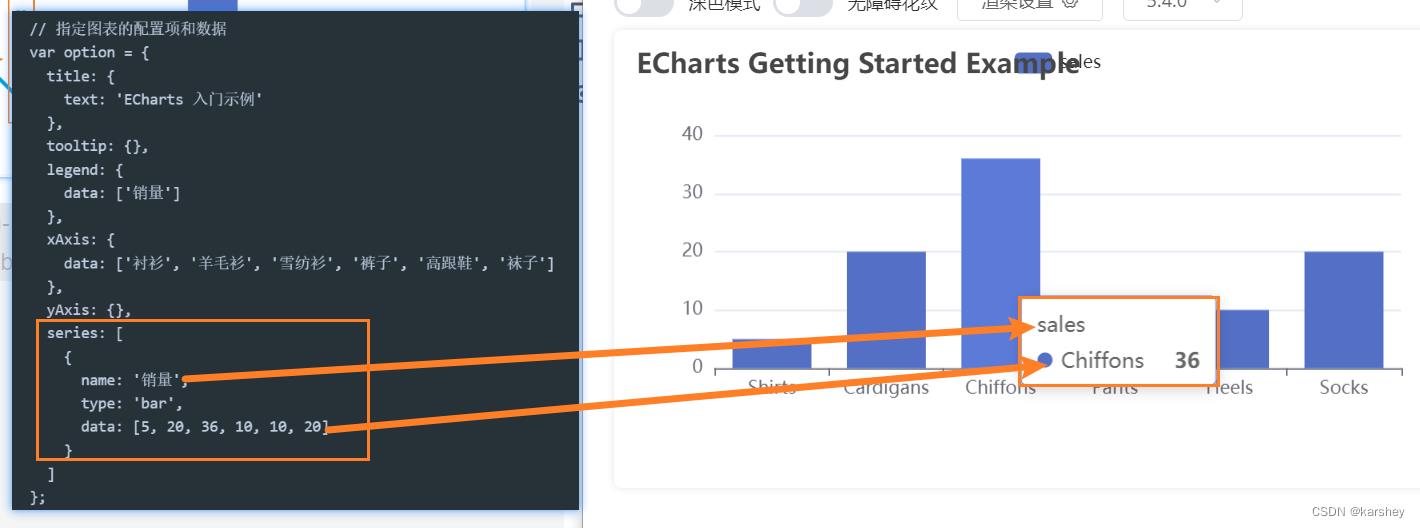
而series对应的是鼠标悬浮在柱上时的显示:
接下来写折线图。
观察一下数据:红框内的是x轴,也就是xAxis,series.name,1013这样的每一个数据都是series.data。

已经配置好的属性:
const order =
    legend:
        // 图例文字颜色
        textStyle:
            color: "#333",
        ,
    ,
    grid:
        left: "20%",
    ,
    // 提示框
    tooltip:
        trigger: "axis",
    ,
    xAxis:
        type: "category", // 类目轴
        data: [],
        axisLine:
            lineStyle:
                color: "#17b3a3",
            ,
        ,
        axisLabel:
            interval: 0,
            color: "#333",
        ,
    ,
    yAxis: [

            type: "value",
            axisLine:
                lineStyle:
                    color: "#17b3a3",
                ,
            ,
        ,
    ],
    color: ["#2ec7c9", "#b6a2de", "#5ab1ef", "#ffb980", "#d87a80", "#8d98b3"],
    series: [],


export default order
我们这里必须配置(自己配置)的属性有:legend、xAxis、yAxis、series。
mounted()
   getData().then((data) =>
       console.log(data);
       this.TableData = data.data.getStatisticalData.data.tableData

       // echarts图表

       // 折线图

       // 基于准备好的dom,初始化echarts实例
       const echarts1 = echarts.init(this.$refs.echarts1)
       var echarts1Option =
       // ES6解构语法
       var  orderData, userData, videoData  = data.data.getStatisticalData.data

       // 获取x轴:要求是一个对象
       const xAxis = Object.keys(orderData.data[0])
       const xAxisData =
           data: xAxis


       // 配置
       echarts1Option.legend = xAxisData
       echarts1Option.xAxis = xAxisData
       echarts1Option.yAxis =
       echarts1Option.series = []

       // 配置series
       xAxis.forEach(key =>
           echarts1Option.series.push(
               name: key,
               type: 'line',
               // key对应的orderData的所有值
               data: orderData.data.map(item => item[key])
           )
       )

       // 使用刚指定的配置项和数据显示图表。
       echarts1.setOption(echarts1Option);
   )
效果:

柱状图:userData
接下来的操作就很类似了。
基础代码:
// 柱状图
const echarts2 = echarts.init(this.$refs.echarts2)
var echarts2Option = user
echarts2.setOption(echarts2Option);
已经配置好的属性:
const user =
    legend:
        // 图例文字颜色
        textStyle:
            color: "#333",
        ,
    ,
    grid:
        left: "20%",
    ,
    // 提示框
    tooltip:
        trigger: "axis",
    ,
    xAxis:
        type: "category", // 类目轴
        data: [],
        axisLine:
            lineStyle:
                color: "#17b3a3",
            ,
        ,
        axisLabel:
            interval: 0,
            color: "#333",
        ,
    ,
    yAxis: [

            type: "value",
            axisLine:
                lineStyle:
                    color: "#17b3a3",
                ,
            ,
        ,
    ],
    color: ["#2ec7c9", "#b6a2de"],
    series: [],


export default user
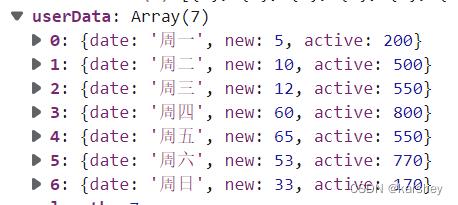
user缺什么,我们这里就配置什么:xAxis.data、series.
显然xAxis.data是date的value:series会有两个,分别是new和active。
// 柱状图
const echarts2 = echarts.init(this.$refs.echarts2)
var echarts2Option = user

// 配置
echarts2Option.xAxis.data = userData.map(item => item.date)
echarts2Option.series = [

        name: '新增用户',
        data: userData.map(item => item.new),
        // 类型:bar是柱状图
        type:'bar'

    ,

        name: '活跃用户',
        data: userData.map(item => item.active),
        type:'bar'

]

echarts2.setOption(echarts2Option);
效果:

饼状图:videoData
配置:
const video =
    tooltip:
        trigger: "item",
    ,
    color: [
        "#0f78f4",
        "#dd536b",
        "#9462e5",
        "#a6a6a6",
        "#e1bb22",
        "#39c362",
        "#3ed1cf",
    ],
    series: [],


export default video
我们只需要自己配series。
// 饼状图
const echarts3 = echarts.init(this.$refs.echarts3)
var echarts3Option = video
echarts3Option.series =
    data: videoData,
    type: 'pie'

echarts3.setOption(echarts3Option);
效果:
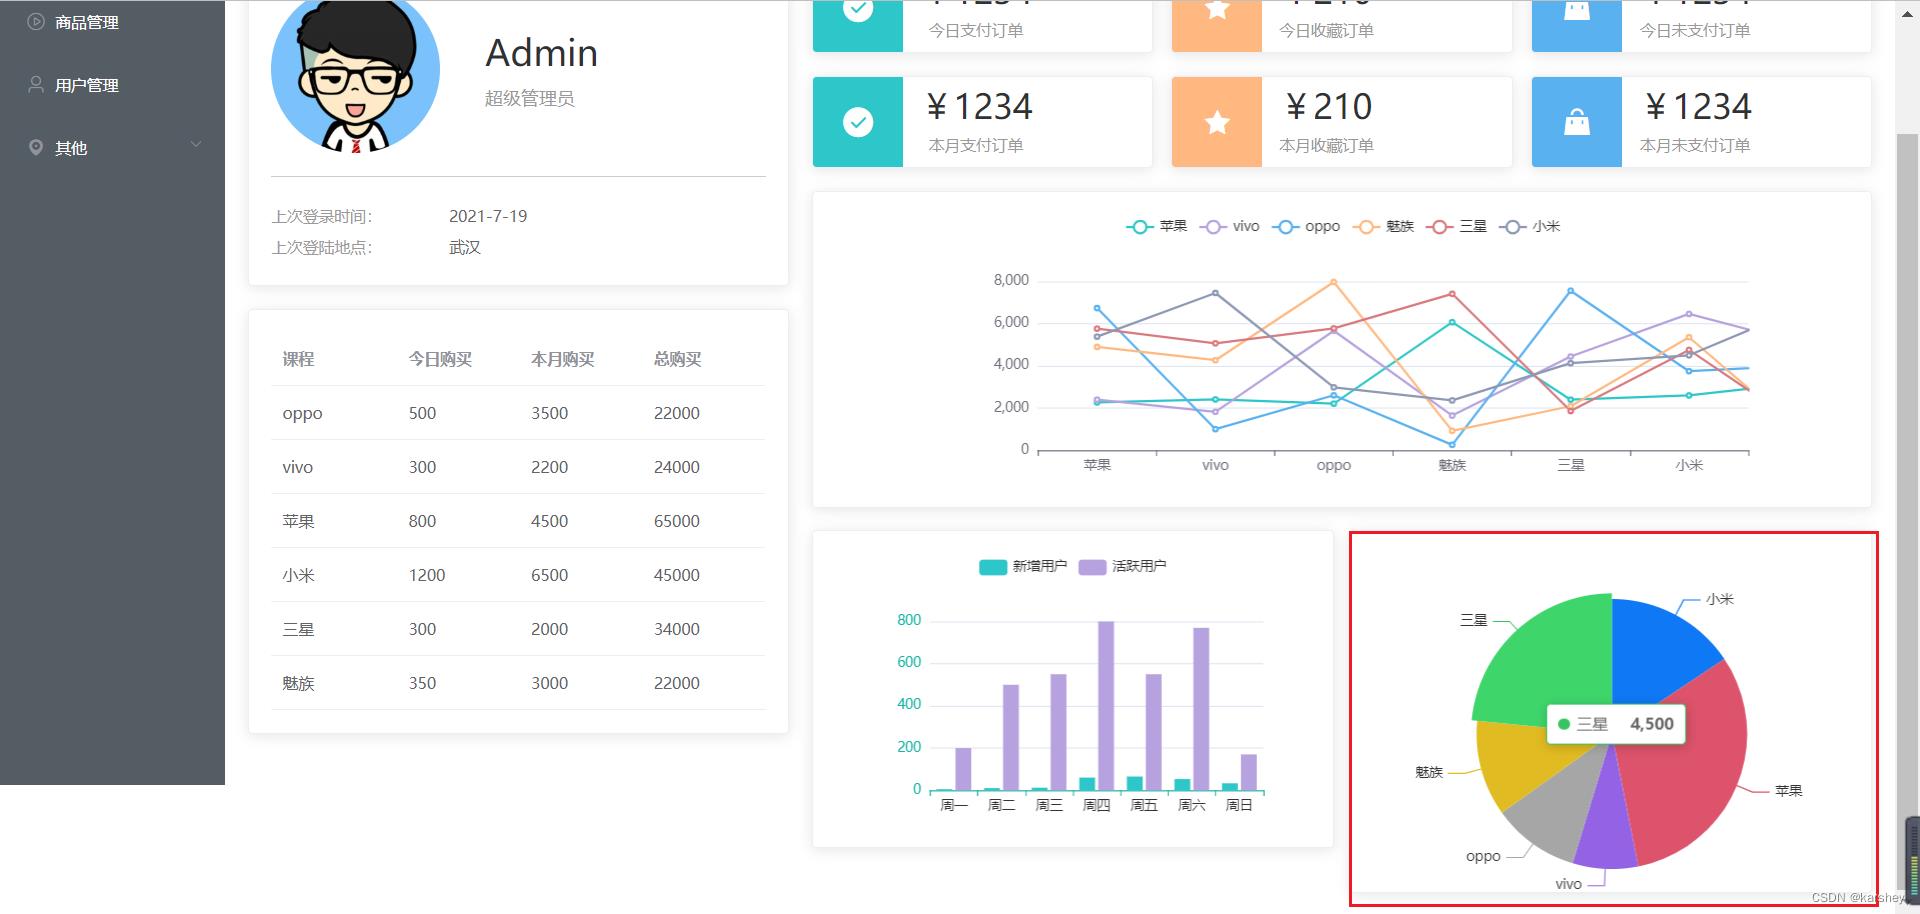
总效果
总代码:Home.vue
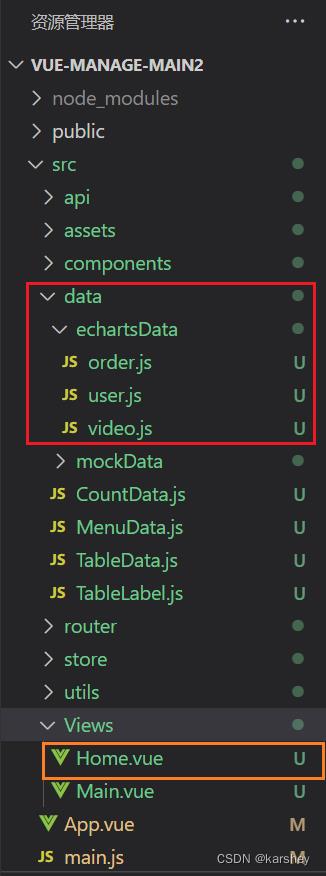
本篇新建的文件和文件夹如红框所示,代码已放在文中。
有更改的问价如橙框所示,代码如下。
<template>
    <el-row>
        <el-col :span="8">
            <!-- user卡片 -->
            <el-card>
                <div class="user">
                    <img src="../assets/images/user.png" alt="">
                    <div class="userInfo">
                        <p div class="name">Admin</p>
                        <p div class="access">超级管理员</p>
                    </div>
                </div>
                <div class="loginInfo">
                    <p>上次登录时间:<span>2021-7-19</span></p>
                    <p>上次登陆地点:<span>武汉</span></p>
                </div>
            </el-card>
            <!-- table卡片 -->
            <el-card style="margin-top: 20px;">
                <el-table :data="TableData" style="width: 100%">
                    <!-- 这里的val,key对应的是对象里的 -->
                    <el-table-column v-for="(value, key) in TableLabel" :prop="key" :label="value">
                    </el-table-column>
                </el-table>
            </el-card>
        </el-col>
        <el-col :span="16">
            <div class="num">
                <el-card v-for="item in CountData" :key="item.name" :body-style=" display: 'flex', padding: 0 ">
                    <i class="icon" :class="`el-icon-$item.icon`" :style=" backgroundColor: item.color "></i>
                    <div class="details">
                        <p class="price"> priceFormate(item.value) </p>
                        <p class="desc"> item.name </p>
                    </div>
                </el-card>
            </div>
            <!-- echarts图表 -->
            <div style="margin-left:20px">
                <!-- 折线图 -->
                <el-card style="height:280px">
                    <div ref="echarts1" style="height:280px"></div>
                </el-card>
                <div class="graph">
                    <!-- 柱状图 -->
                    <el-card style="height:280px">
                        <div ref="echarts2" style="height:280px"></div>
                    </el-card>
                    <!-- 饼状图 -->
                    <el-card style="height:320px">
                        <div ref以上是关于在vue中 echarts 柱状图调后台接口的主要内容,如果未能解决你的问题,请参考以下文章