DSP using MATLAB 示例Example3.9
Posted 沧海一粟
tags:
篇首语:本文由小常识网(cha138.com)小编为大家整理,主要介绍了DSP using MATLAB 示例Example3.9相关的知识,希望对你有一定的参考价值。
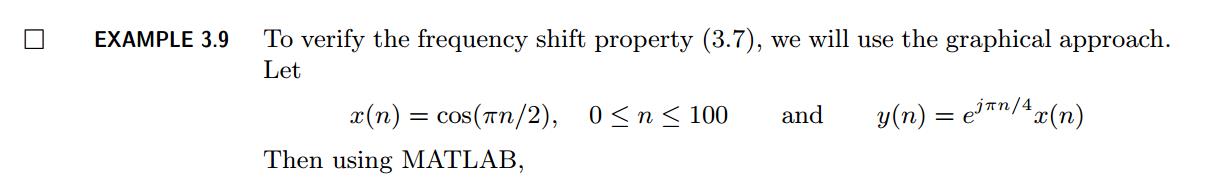
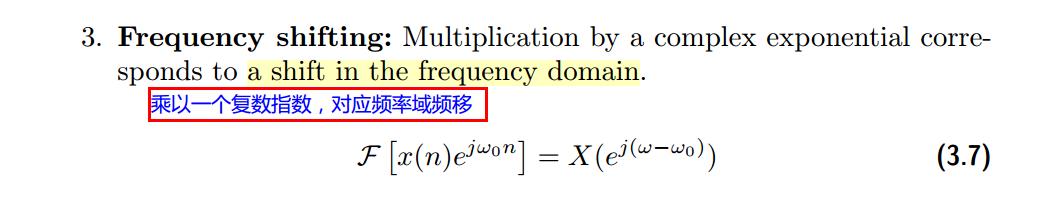
用到的性质
上代码:
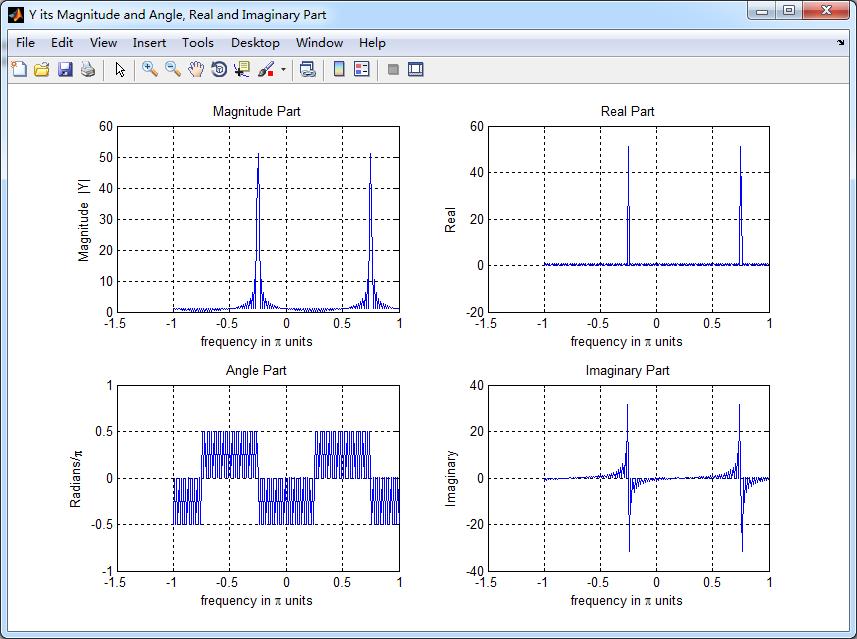
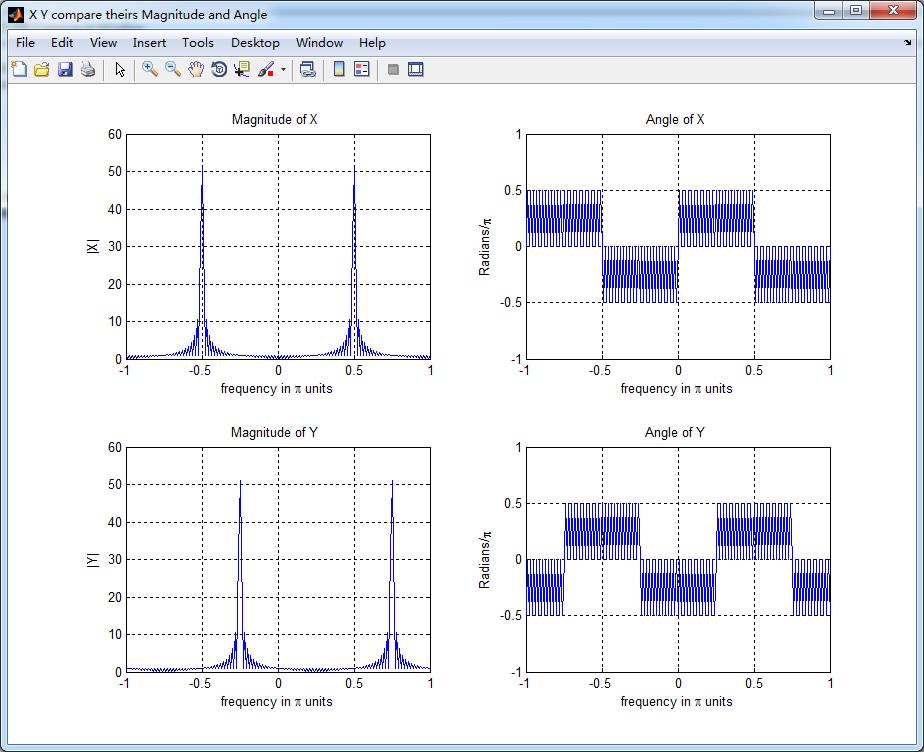
n = 0:100; x = cos(pi*n/2);
k = -100:100; w = (pi/100)*k;                 % freqency between -pi and +pi  ,   [0,pi] axis divided into 101 points.
X = x * (exp(-j*pi/100)) .^ (n\'*k);           % DTFT of x

% signal multiplied
y = exp(j*pi*n/4) .* x;                    % signal multiplied by exp(j*pi*n*4)
Y = y * (exp(-j*pi/100)) .^ (n\'*k);        % DTFT of y

magX = abs(X); angX = angle(X); realX = real(X); imagX = imag(X);
magY = abs(Y); angY = angle(Y); realY = real(Y); imagY = imag(Y);

%verification
%Y_check = (exp(-j*2) .^ w) .* X;             % multiplication by exp(-j2w)
%error = max(abs(Y-Y_check));                 % Difference

figure(\'NumberTitle\', \'off\', \'Name\', \'x & y sequence\')
set(gcf,\'Color\',\'white\');
subplot(2,1,1); stem(n,x); title(\'x=cos(\\pin/2) sequence\');             xlabel(\'n\'); ylabel(\'x(n)\'); grid on;
subplot(2,1,2); stem(n,y); title(\'y=exp(j\\pin/4)cos(\\pin/2) sequence\'); xlabel(\'n\'); ylabel(\'y(n)\'); grid on;

%% --------------------------------------------------------------
%%        START X\'s  mag ang real imag
%% --------------------------------------------------------------
figure(\'NumberTitle\', \'off\', \'Name\', \'X its Magnitude and Angle, Real and Imaginary Part\');
set(gcf,\'Color\',\'white\');
subplot(2,2,1); plot(w/pi,magX); grid on;  % axis([-2,2,0,15]);
title(\'Magnitude Part\');
xlabel(\'frequency in \\pi units\'); ylabel(\'Magnitude  |X|\');
subplot(2,2,3); plot(w/pi, angX/pi); grid on;  % axis([-2,2,-1,1]);
title(\'Angle Part\');
xlabel(\'frequency in \\pi units\'); ylabel(\'Radians/\\pi\');

subplot(\'2,2,2\'); plot(w/pi, realX); grid on;
title(\'Real Part\');
xlabel(\'frequency in \\pi units\'); ylabel(\'Real\');
subplot(\'2,2,4\'); plot(w/pi, imagX); grid on;
title(\'Imaginary Part\');
xlabel(\'frequency in \\pi units\'); ylabel(\'Imaginary\');
%% --------------------------------------------------------------
%%        END X\'s  mag ang real imag
%% --------------------------------------------------------------

%% --------------------------------------------------------------
%%        START Y\'s  mag ang real imag
%% --------------------------------------------------------------
figure(\'NumberTitle\', \'off\', \'Name\', \'Y its Magnitude and Angle, Real and Imaginary Part\');
set(gcf,\'Color\',\'white\');
subplot(2,2,1); plot(w/pi,magY); grid on;  % axis([-2,2,0,15]);
title(\'Magnitude Part\');
xlabel(\'frequency in \\pi units\'); ylabel(\'Magnitude  |Y|\');
subplot(2,2,3); plot(w/pi, angY/pi); grid on;  % axis([-2,2,-1,1]);
title(\'Angle Part\');
xlabel(\'frequency in \\pi units\'); ylabel(\'Radians/\\pi\');

subplot(\'2,2,2\'); plot(w/pi, realY); grid on;
title(\'Real Part\');
xlabel(\'frequency in \\pi units\'); ylabel(\'Real\');
subplot(\'2,2,4\'); plot(w/pi, imagY); grid on;
title(\'Imaginary Part\');
xlabel(\'frequency in \\pi units\'); ylabel(\'Imaginary\');

%% --------------------------------------------------------------
%%        END Y\'s  mag ang real imag
%% --------------------------------------------------------------

%% ----------------------------------------------------------------
%%        START Graphical verification
%% ----------------------------------------------------------------
figure(\'NumberTitle\', \'off\', \'Name\', \'X Y compare theirs Magnitude and Angle\');
set(gcf,\'Color\',\'white\');
subplot(2,2,1); plot(w/pi,magX); grid on; axis([-1,1,0,60]);
xlabel(\'frequency in \\pi units\'); ylabel(\'|X|\'); title(\'Magnitude of X \');
subplot(2,2,2); plot(w/pi,angX/pi); grid on; axis([-1,1,-1,1]);
xlabel(\'frequency in \\pi units\'); ylabel(\'Radians/\\pi\'); title(\'Angle of X \');

subplot(2,2,3); plot(w/pi,magY); grid on; axis([-1,1,0,60]);
xlabel(\'frequency in \\pi units\'); ylabel(\'|Y|\'); title(\'Magnitude of Y \');
subplot(2,2,4); plot(w/pi,angY/pi); grid on; axis([-1,1,-1,1]);
xlabel(\'frequency in \\pi units\'); ylabel(\'Radians/\\pi\'); title(\'Angle of Y \');

%% ----------------------------------------------------------------
%%        END Graphical verification
%% ----------------------------------------------------------------
运行结果:


以上是关于DSP using MATLAB 示例Example3.9的主要内容,如果未能解决你的问题,请参考以下文章