[读书笔记]机器学习:实用案例解析
Posted gy_jerry
tags:
篇首语:本文由小常识网(cha138.com)小编为大家整理,主要介绍了[读书笔记]机器学习:实用案例解析相关的知识,希望对你有一定的参考价值。
第8章 PCA:构建股票市场指数
有监督学习:发掘数据中的结构,并使用一个信号量评价我们在探索真实情况这项工作是否进行得很好。
无监督学习:发掘数据中的结构,但没有任何已知答案指导
主成分分析(Principle Components Analysis, PCA):根据每一列包含原始数据信息的多少,对源数据进行排序,排在第一列的成为第一主成分(主成分),总是包含了整个数据集的绝大部分结构。
本章通过构建股市指数来讨论主成分分析问题。
prices <- read.csv(\'ML_for_Hackers/08-PCA/data/stock_prices.csv\')

library(lubridate)
library(reshape)
library(ggplot2)

#修改日期格式,并将三列根据不同股票转成多列
prices <- transform(prices, Date = ymd(Date))
date.stock.matrix <- cast(prices, Date ~ Stock, value = \'Close\')

#according to the date.stock.matrix, there are some missing values in the row \'2002-02-01\' and the colomn \'DDR\'
#删除缺失值后重新做上面两步
prices <- subset(prices, Date != ymd(\'2002-02-01\'))
prices <- subset(prices, Stock != \'DDR\')
date.stock.matrix <- cast(prices, Date ~ Stock, value = \'Close\')
找出所有列之间的相关性,画出相关性密度图
cor.matrix <- cor(date.stock.matrix[, 2:ncol(date.stock.matrix)])
correlations <- as.numeric(cor.matrix)
ggplot(data.frame(Correlation = correlations), aes(x = Correlation, fill = 1)) + geom_density() + theme(legend.position = \'none\')

由于大部分相关性是正数,因此可以说PCA适用于这份数据集
pca <- princomp(date.stock.matrix[, 2:ncol(date.stock.matrix)])
pca

提取第一主成分的载荷量(loadings)。载荷量表现了每一列有多少信息包含在主成分中,因为我们只研究第一主成分,所以
principal.component <- pca$loadings[, 1]
loadings <- as.numeric(principal.component)
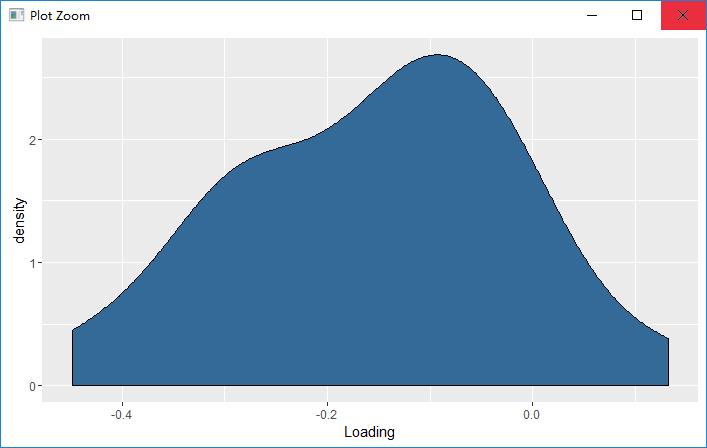
ggplot(data.frame(Loading = loadings), aes(x = Loading, fill = 1)) + geom_density() + theme(legend.position = \'none\')

可以看到分布比较合理,但是大部分载荷量为负数,这个问题可以以后解决
通过主成分分析对股市指数进行预测:
market.index <- predict(pca)[, 1]
为了评价我们的预测效果,将预测得到的股市指数与道琼斯指数(一种著名的股市指数)相比较
dji.prices <- read.csv(\'ML_for_Hackers/08-PCA/data/DJI.csv\')
dji.prices <- transform(dji.prices, Date = ymd(Date))
dji.prices <- subset(dji.prices, Date > ymd(\'2001-12-31\'))
dji.prices <- subset(dji.prices, Date != ymd(\'2002-02-01\'))
dji <- with(dji.prices, rev(Close))
dates <- with(dji.prices, rev(Date))

comparision <- data.frame(Date = dates, MarketIndex = market.index, DJI = dji)
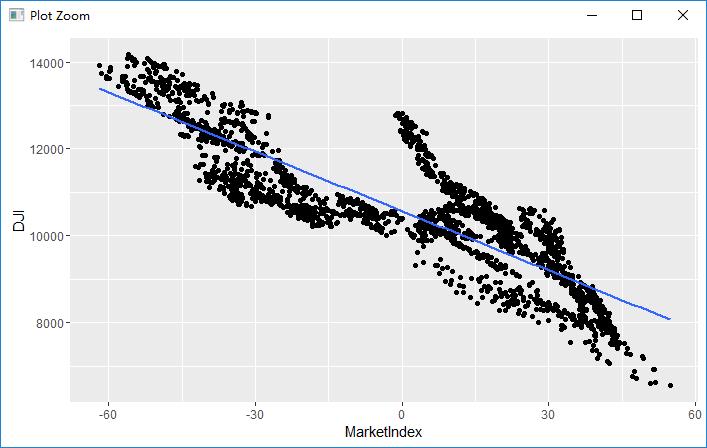
ggplot(comparision, aes(x = MarketIndex, y = DJI)) + geom_point() + geom_smooth(method = \'lm\', se = FALSE)

这里注意到预测与“实际是负相关的”,这也是上文所说的载荷为负数带来的问题。这个小问题只需要乘(-1)即可解决
comparision <- transform(comparision, MarketIndex = -1 *MarketIndex)
ggplot(comparision, aes(x = MarketIndex, y = DJI)) + geom_point() + geom_smooth(method = \'lm\', se = FALSE)

根据结果来看,预测得到的MarketIndex与DJI匹配程度较大
接下来,探究预测的股市指数与真实股市指数相对于时间的一致性
alt.comparision <- melt(comparision, id.vars = \'Date\')
names(alt.comparision) <- c(\'Date\', \'Index\', \'Price\')
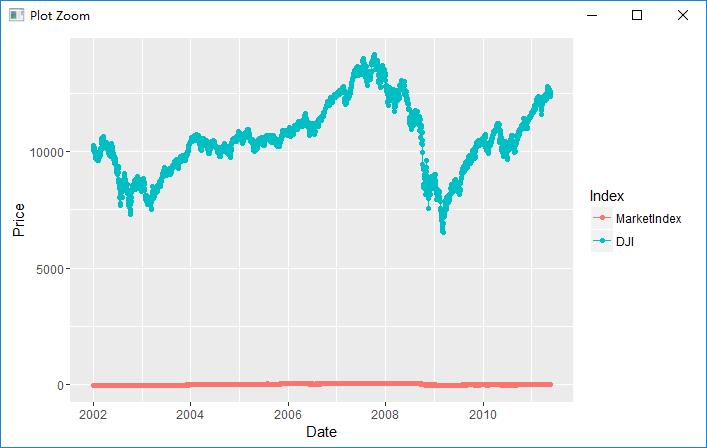
ggplot(alt.comparision, aes(x = Date, y = Price, group = Index, color = Index)) + geom_point() + geom_line()

注意到由于数值差异大,造成无法看清楚趋势,需要scaling
comparision <- transform(comparision, MarketIndex = scale(MarketIndex))
comparision <- transform(comparision, DJI = scale(DJI))
alt.comparision <- melt(comparision, id.vars = \'Date\')
names(alt.comparision) <- c(\'Date\', \'Index\', \'Price\')
ggplot(alt.comparision, aes(x = Date, y = Price, group = Index, color = Index)) + geom_point() + geom_line()

这里看到,通过主成分分析得到的股市指数与“真实的”股市指数之间相当匹配,这说明了PCA在简化数据的过程中起到了很强大的作用。另一种简化数据的思路是独立成分分析(Independent Component Analysis, ICA),这是PCA的一个变形,在某些不能使用PCA的情况下可以发挥一定作用。
以上是关于[读书笔记]机器学习:实用案例解析的主要内容,如果未能解决你的问题,请参考以下文章