在C# 与ms chart中,能否给每个柱状图的柱子下方添加标签
Posted
tags:
篇首语:本文由小常识网(cha138.com)小编为大家整理,主要介绍了在C# 与ms chart中,能否给每个柱状图的柱子下方添加标签相关的知识,希望对你有一定的参考价值。
在ms chart做的图表中,柱状图的柱子下方的标签想显示 “男”和“女”,现在是用这样的代码写的:
CustomLabel x_customLabel = new CustomLabel();
x_customLabel.Name = "Label" + i;
x_customLabel.FromPosition = i;
x_customLabel.ToPosition = x;
x_customLabel.Text = XLabel;
cur_ChartArea.AxisX.CustomLabels.Add(x_customLabel);
每根柱子都是用DataPoint,这样的代码添加 DataPoint1.SetValueXY(XLabel, YLabel);
可是这样每个CustomLabel 的位置好必须自己计算,好麻烦。主要是我还没理解FromPosition ,ToPosition 。
能不能类似 DataPoint1.Label="男"这样,然后这根柱子下方标签,x轴上显示男呢?
但是label标签要显示点的y值,不能用来显示x轴刻度。
能否帮我解释下FromPosition ,ToPosition?
是否要取得每个柱子的位置和高宽,然后自己画呢?
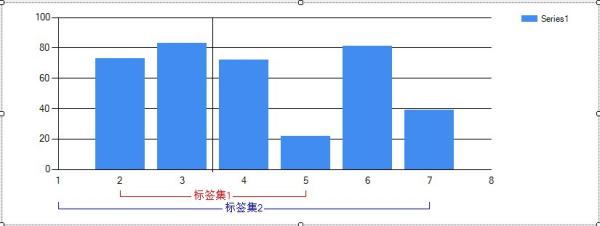
CustomLabel是标签集。如果设置显示标记线,可以清楚看到标签集标记的范围是从FromPosition(标签集的开始位置)到ToPosition(标签集的结束位置)。
如下图:
添加了两个标签集。
标签集1:FromPosition=2,ToPosition=5,RowIndex=1;
标签集2:FromPosition=1,ToPosition=7,RowIndex=2;

表X轴刻度修改成0.1。
增加标签集3:FromPosition=5.7,ToPosition=7.9,RowIndex=3;
如下图:

不行,label要显示y值呢
以上是关于在C# 与ms chart中,能否给每个柱状图的柱子下方添加标签的主要内容,如果未能解决你的问题,请参考以下文章