[Matlab]二维统计分析图实例
Posted 静待花开
tags:
篇首语:本文由小常识网(cha138.com)小编为大家整理,主要介绍了[Matlab]二维统计分析图实例相关的知识,希望对你有一定的参考价值。
常见的二维统计分析图形:
- bar(x,y,选项) 条形图
- stairs(x,y,选项) 阶梯图
- stem(x,y,选项) 杆图
- fill(x1,y1,选项1,x2,y2,选项2,……) 填充图
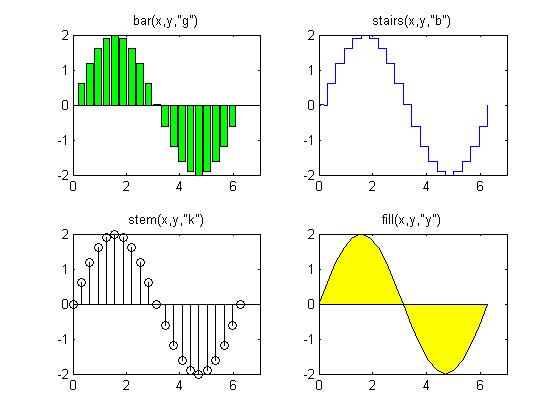
实例:绘制曲线y=2sin(x)的统计图
x = 0:pi/10:2*pi;
y = 2*sin(x);
subplot(2,2,1);
bar(x,y,\'g\');
title(\'bar(x,y,"g")\');
axis([0,7,-2,2]);
subplot(2,2,2);
stairs(x,y,\'b\');
title(\'stairs(x,y,"b")\');
axis([0,7,-2,2]);
subplot(2,2,3);
stem(x,y,\'k\');
title(\'stem(x,y,"k")\');
axis([0,7,-2,2]);
subplot(2,2,4);
fill(x,y,\'y\');
title(\'fill(x,y,"y")\');
axis([0,7,-2,2]);

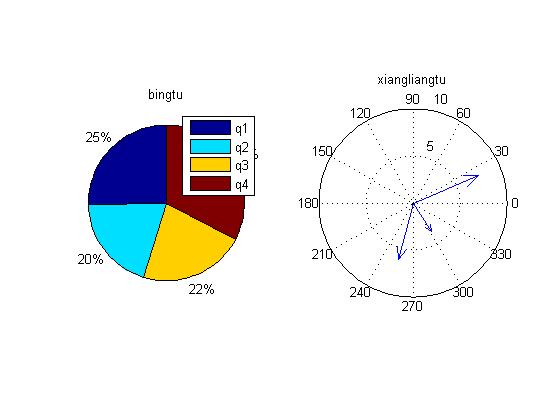
实例:绘制饼图和复数的向量图
subplot(1,2,1);
pie([2347,1827,2043,3025]);
title(\'bingtu\');
legend(\'q1\',\'q2\',\'q3\',\'q4\');
subplot(1,2,2);
compass([7+2.9i,2-3i,-1.5-6i]);
title(\'xiangliangtu\');

以上是关于[Matlab]二维统计分析图实例的主要内容,如果未能解决你的问题,请参考以下文章