电信网络拓扑图自动布局之曲线布局
Posted xhload3d
tags:
篇首语:本文由小常识网(cha138.com)小编为大家整理,主要介绍了电信网络拓扑图自动布局之曲线布局相关的知识,希望对你有一定的参考价值。
在前面《电信网络拓扑图自动布局之总线》一文中,我们重点介绍了自定义 EdgeType 的使用,概括了实现总线效果的设计思路,那么今天话题是基于 HT for Web 的曲线布局(ShapeLayout)。
ShapeLayout 从字面上的意思理解,就是根据曲线路径来布局节点,省去手动布局节点的繁琐操作,还能保证平滑整齐地排布,这是手动调整很难做到的。ShapeLayout 结合前面提到的总线,是最普遍的应用。

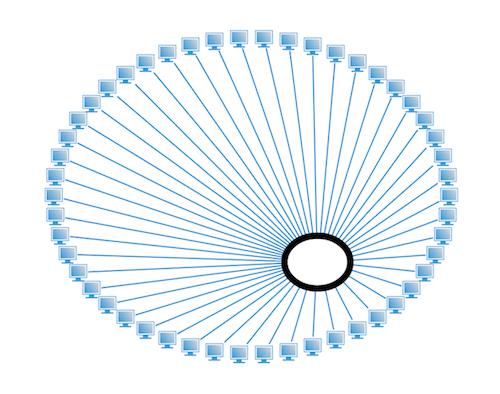
http://www.hightopo.com/demo/EdgeType/ShapeLayout-Oval.html
我们先来看看最简单的圆和椭圆是如何实现自动布局的。我们知道在几何学中,圆和椭圆是可以用三角函数老表示,那么我们就可以将圆或者椭圆分成若干份,通过三角函数就可以算出圆或椭圆上的一点,将节点放到计算出来的点的位置,这样就可以达到自动布局的效果。具体的核心代码如下:
var radians = Math.PI * 2 / nodeCount,
    w = width / 2,
    h = height / 2,
    a = Math.max(w, h),
    b = Math.min(w, h),
    x, y, rad, node;
if (shape === \'circle\') a = b = Math.min(a, b);
for (var i = 0; i < nodeCount; i++) {
    rad = radians * i;
    x = a * Math.cos(rad) + position.x + offset.x;
    y = b * Math.sin(rad) + position.y + offset.y;
    node = this._nodes[i];
    if (!node) continue;
    if (!anim)
        node.setPosition({ x: x, y: y });
    else {
        anim.action = function(pBegin, pEnd, v) {
            this.setPosition({
                x: pBegin.x + (pEnd.x - pBegin.x) * v,
                y: pBegin.y + (pEnd.y - pBegin.y) * v
            });
        }.bind(node, node.getPosition(), { x: x, y: y });
        ht.Default.startAnim(anim);
    }
}
当然,会有人会问,对椭圆按照角度平均分成若干份计算出来的位置并不是等距的,没错,确实不是等距的,这这边就简单处理了,如果要弧度等距的话,那这个就真麻烦了,在这边就不做阐述了,也没办法阐述,因为我也不懂。

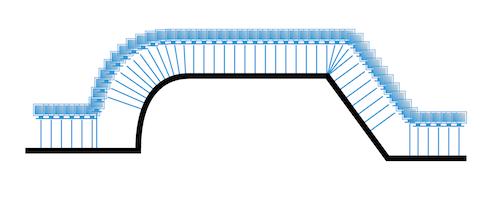
http://www.hightopo.com/demo/EdgeType/ShapeLayout.html
如上图的例子,节点沿着某条曲线均匀布局,那么这种不是特殊形状的连线组合是怎么实现自动布局的呢?其实也很简单,在前面总线章节中就有提到,将曲线分割若干小线段,每次计算固定长度,当判断落点在某条线段上的时候,就可以将问题转换为求线段上一点的数学问题,和总线一样,曲线的切割精度需要用户来定义,在不同的应用场景中,需求可能不太一样。
preP = beginP;
var nodeIndex = 0, indexLength, node;
for (; i < pointsCount;) {
    p = this._calculationPoints[i];
    indexLength = padding + resolution * nodeIndex;
    if (p.totalLength < indexLength) {
        preP = p;
        i++;
        continue;
    }
    node = this._nodes[nodeIndex++];
    if (!node) break;

    dis = indexLength - preP.totalLength;
    tP = getPointWithLength(dis, preP.point, p.point);

    p = {
        x: tP.x + position.x + offset.x - width / 2,
        y: tP.y + position.y + offset.y - height / 2
    };
    if (!anim)
        node.setPosition(p);
    else {
        anim.action = function(pBegin, pEnd, v) {
            this.setPosition({
                x: pBegin.x + (pEnd.x - pBegin.x) * v,
                y: pBegin.y + (pEnd.y - pBegin.y) * v
            });
        }.bind(node, node.getPosition(), p);
        ht.Default.startAnim(anim);
    }

    preP = {
        point: tP,
        distance: dis,
        totalLength: indexLength
    };
}
以上就是非特殊形状的连线组合的核心代码,这也只是代码片段,可能理解起来还是会比较吃力的,那么下面我将贴上源代码,有兴趣的朋友可以帮忙瞅瞅,有什么不妥的,欢迎指出。
;(function(window, ht) {
    var distance = function(p1, p2) {
        var dx = p2.x - p1.x,
            dy = p2.y - p1.y;
        return Math.sqrt(Math.pow(dx, 2) + Math.pow(dy, 2));
    };
    var bezier2 = function(t, p0, p1, p2) {
        var t1 = 1 - t;
        return t1*t1*p0 + 2*t*t1*p1 + t*t*p2;
    };
    var bezier3 = function(t, p0, p1, p2, p3 ) {
        var t1 = 1 - t;
        return t1*t1*t1*p0 + 3*t1*t1*t*p1 + 3*t1*t*t*p2 + t*t*t*p3;
    };
    var getPointWithLength = function(length, p1, p2) {
        var dis = distance(p1, p2),
            temp = length / dis,
            dx = p2.x - p1.x,
            dy = p2.y - p1.y;
        return { x: p1.x + dx * temp, y: p1.y + dy * temp };
    };

    var ShapeLayout = ht.ShapeLayout = function() {};

    ht.Default.def(\'ht.ShapeLayout\', Object, {
        ms_fire: 1,
        ms_ac: [\'padding\', \'offset\', \'shape\', \'closePath\', \'position\', \'width\', \'height\'],

        calculationSize: function() {
            if (!this._points) return;
            var min = { x: Infinity, y: Infinity},
                max = { x: -Infinity, y: -Infinity},
                p, len = this._points.length;
            for (var i = 0; i < len; i++) {
                p = this._points[i];
                min.x = Math.min(min.x, p.x);
                min.y = Math.min(min.y, p.y);
                max.x = Math.max(max.x, p.x);
                max.y = Math.max(max.y, p.y);
            }
            this._width = max.x - min.x;
            this._height = max.y - min.y;
            this._position = {
                x: min.x + this._width / 2,
                y: min.y + this._height / 2
            };
        },

        _points: null,
        getPoints: function() { return this._points; },
        setPoints: function(value) {
            if (value instanceof Array)
                this._points = value.slice(0);
            else if (value instanceof ht.List)
                this._points = value._as.slice(0);
            else
                this._points = null;
            this.__calcuPoints = !!this._points;

            this.calculationSize();
        },

        _segments: null,
        getSegments: function() { return this._segments; },
        setSegments: function(value) {
            if (value instanceof Array)
                this._segments = value.slice(0);
            else if (value instanceof ht.List)
                this._segments = value._as.slice(0);
            else
                this._segments = null;
            this.__calcuPoints = !!this._segments;
        },

        _style: {},
        s: function() {
            return this.setStyle.apply(this, arguments);
        },
        setStyle: function() {
            var name = arguments[0],
                value = arguments[1];
            if (arguments.length === 1) {
                if (typeof name === \'object\'){
                    for (var n in name)
                        this._style[n] = name[n];
                }
                else
                    return this._style[name];
            }
            else
                this._style[name] = value;
        },

        _nodes: null,
        getNodes: function() { return this._nodes; },
        setNodes: function(value) {
            if (value instanceof Array)
                this._nodes = value.slice(0);
            else if (value instanceof ht.List)
                this._nodes = value._as.slice(0);
            else
                this._nodes = null;
        },
        addNode: function(node) {
            if (!this._nodes) this._nodes = [];
            this._nodes.push(node);
        },

        _calculationPoints: [],
        splitPoints: function() {
            if (!this._points || this._points.length === 0) {
                alert(\'Please set points with setPoints method!\');
                return;
            }

            var points = this._points.slice(0),
                segments;
            if (!this._segments || this._segments.length === 0) {
                segments = points.map(function(p, index) { return 2; });
                segments[0] = 1;
            }
            else {
                segments = this._segments.slice(0);
            }

            this._calculationPoints.length = 0;
            var beginPoint = points[0],
                preP = {
                    point: { x: beginPoint.x, y: beginPoint.y },
                    distance: 0,
                    totalLength: 0
                };
            this._calculationPoints.push(preP);
            var length = segments.length,
                pointIndex = 1, seg, p, tP, dis,
                p0, p1, p2, p3, j,
                curveResolution = this.s(\'curve.resolution\') || 50;

            var calcuPoints = function(currP) {
                dis = distance(preP.point, currP);
                p = {
                    point: { x: currP.x, y: currP.y },
                    distance: dis,
                    totalLength: preP.totalLength + dis
                };
                this._calculationPoints.push(p);
                preP = p;
            }.bind(this);
            for (var i = 1; i < length; i++) {
                seg = segments[i];
                if (seg === 1) {
                    tP = points[pointIndex++];
                    p = {
                        point: { x: tP.x, y: tP.y },
                        distance: 0,
                        totalLength: preP.totalLength
                    };
                    this._calculationPoints.push(p);
                    preP = p;
                }
                else if (seg === 2) { calcuPoints(points[pointIndex++]); }
                else if (seg === 3) {
                    p1 = points[pointIndex++];
                    p2 = points[pointIndex++];
                    p0 = preP.point;
                    for (j = 1; j <= curveResolution; j++) {
                        tP = {
                            x: bezier2(j / curveResolution, p0.x, p1.x, p2.x),
                            y: bezier2(j / curveResolution, p0.y, p1.y, p2.y)
                        };
                        calcuPoints(tP);
                    }
                }
                else if (seg === 4) {
                    p1 = points[pointIndex++];
                    p2 = points[pointIndex++];
                    p3 = points[pointIndex++];
                    p0 = preP.point;
                    for (j = 1; j <= curveResolution; j++) {
                        tP = {
                            x: bezier3(j / curveResolution, p0.x, p1.x, p2.x, p3.x),
                            y: bezier3(j / curveResolution, p0.y, p1.y, p2.y, p3.y)
                        };
                        calcuPoints(tP);
                    }
                }
                else if (seg === 5) {
                    tP = this._calculationPoints[0].point;
                    calcuPoints(tP);
                }
            }
            this._totalLength = preP.totalLength;
        },

        layout: function(anim) {
            if (!this._nodes || this._nodes.length === 0) {
                alert(\'Please set nodes width setNode method!\');
                return;
            }

            var nodeCount = this._nodes.length,
                shape = this._shape,
                shapeList = [\'circle\', \'oval\'],
                offset = this._offset || { x: 0, y: 0 },
                position = this._position || { x: 0, y: 0 },
                width = this._width || 0,
                height = this._height || 0;
            if (shape && shapeList.indexOf(shape) >= 0) {
                var radians = Math.PI * 2 / nodeCount,
                    w = width / 2,
                    h = height / 2,
                    a = Math.max(w, h),
                    b = Math.min(w, h),
                    x, y, rad, node;
                if (shape === \'circle\') a = b = Math.min(a, b);
                for (var i = 0; i < nodeCount; i++) {
                    rad = radians * i;
                    x = a * Math.cos(rad) + position.x + offset.x;
                    y = b * Math.sin(rad) + position.y + offset.y;
                    node = this._nodes[i];
                    if (!node) continue;
                    if (!anim)
                        node.setPosition({ x: x, y: y });
                    else {
                        anim.action = function(pBegin, pEnd, v) {
                            this.setPosition({
                                x: pBegin.x + (pEnd.x - pBegin.x) * v,
                                y: pBegin.y + (pEnd.y - pBegin.y) * v
                            });
                        }.bind(node, node.getPosition(), { x: x, y: y });
                        ht.Default.startAnim(anim);
                    }
                }
                return;
            }

            if (!this._calculationPoints || this.__calcuPoints)
                this.splitPoints();

            var padding = this._padding || 0,
                length = this._totalLength - 2 * padding,
                resolution = length / (nodeCount - (this._closePath ? 0 : 1)),
                i = 1, p, preP, beginP, dis,
                pointsCount = this._calculationPoints.length;
            for (; i < pointsCount; i++) {
                p = this._calculationPoints[i];
                if (p.totalLength < padding) continue;
                preP = this._calculationPoints[i - 1];
                dis = padding - preP.totalLength;
                beginP = {
                    point: getPointWithLength(dis, preP.point, p.point),
                    distance: p.distance - dis,
                    totalLength: padding
                };
                break;
            }

            preP = beginP;
            var nodeIndex = 0, indexLength, node;
            for (; i < pointsCount;) {
                p = this._calculationPoints[i];
                indexLength = padding + resolution * nodeIndex;
                if (p.totalLength < indexLength) {
                    preP = p;
                    i++;
                    continue;
                }
                node = this._nodes[nodeIndex++];
                if (!node) break;

                dis = indexLength - preP.totalLength;
                tP = getPointWithLength(dis, preP.point, p.point);

                p = {
                    x: tP.x + position.x + offset.x - width / 2,
                    y: tP.y + position.y + offset.y - height / 2
                };
                if (!anim)
                    node.setPosition(p);
                else {
                    anim.action = function(pBegin, pEnd, v) {
                        this.setPosition({
                            x: pBegin.x + (pEnd.x - pBegin.x) * v,
                            y: pBegin.y + (pEnd.y - pBegin.y) * v
                        });
                    }.bind(node, node.getPosition(), p);
                    ht.Default.startAnim(anim);
                }

                preP = {
                    point: tP,
                    distance: dis,
                    totalLength: indexLength
                };
            }
        }
    });
}(window, ht));
以上是关于电信网络拓扑图自动布局之曲线布局的主要内容,如果未能解决你的问题,请参考以下文章