plt.legend()给图像加上图例,以区分哪个图形属于哪个
Posted 小小喽啰
tags:
篇首语:本文由小常识网(cha138.com)小编为大家整理,主要介绍了plt.legend()给图像加上图例,以区分哪个图形属于哪个相关的知识,希望对你有一定的参考价值。
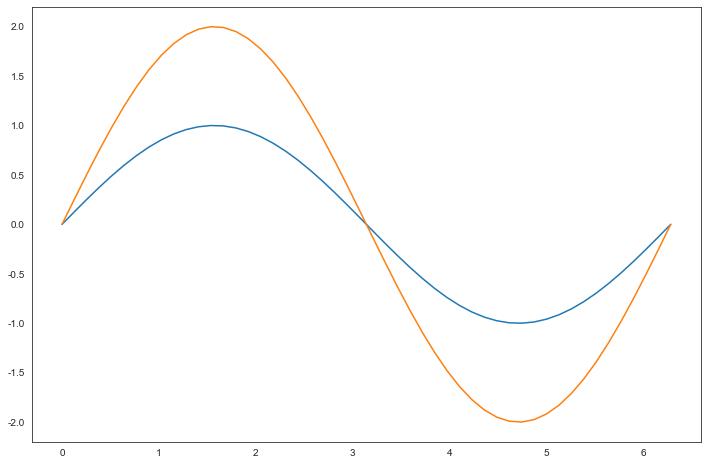
用于多个图形画在同一画框中,以区分哪个图形属于哪个
import matplotlib.pyplot as plt
import numpy as np
x = np.linspace(0, 2 * np.pi, 50)
y = np.sin(x)
plt.plot(x, y)
plt.plot(x, y * 2)

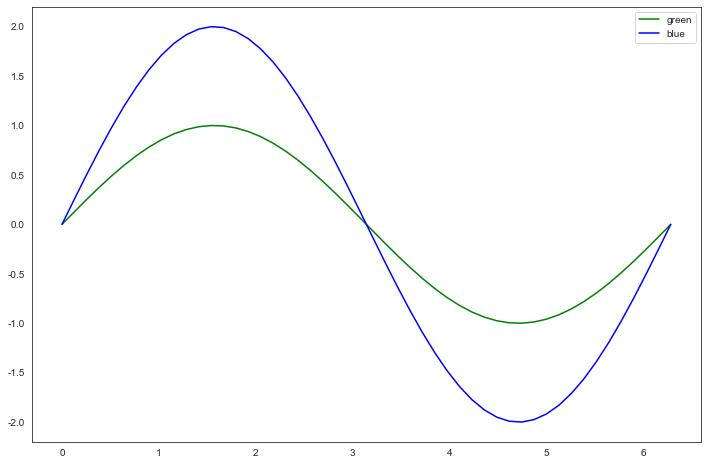
加上这个函数,就知道它的作用了
import matplotlib.pyplot as plt
import numpy as np
x = np.linspace(0, 2 * np.pi, 50)
y = np.sin(x)
plt.plot(x, y,c=\'green\')
plt.plot(x, y * 2,c=\'blue\')
plt.legend([\'green\',\'blue\'])

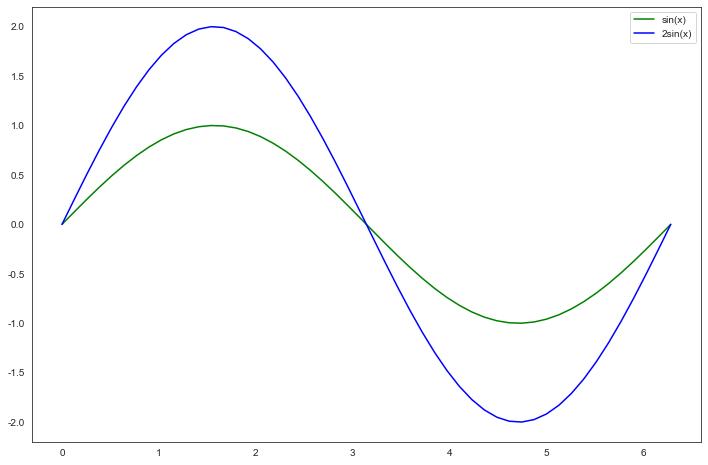
或者是这样子
import matplotlib.pyplot as plt
import numpy as np
x = np.linspace(0, 2 * np.pi, 50)
y = np.sin(x)
plt.plot(x, y, label="sin(x)",c=\'green\')
plt.plot(x, y * 2, label="2sin(x)",c=\'blue\')
plt.legend()

以上是关于plt.legend()给图像加上图例,以区分哪个图形属于哪个的主要内容,如果未能解决你的问题,请参考以下文章