《机器学习》周志华 习题答案3.6
Posted 机器人小z
tags:
篇首语:本文由小常识网(cha138.com)小编为大家整理,主要介绍了《机器学习》周志华 习题答案3.6相关的知识,希望对你有一定的参考价值。
原题:线性判别分析仅在线性可分数据上能获得理想结果,试设计一个改进方法,使其能够用于非线性可分数据。
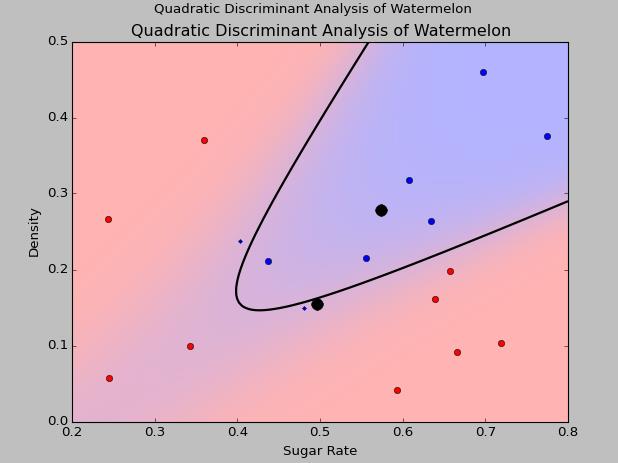
这里我采用二次判别分析来对原来的西瓜数据集进行分类,同样采用sklearn里的二次判别库。
#!/usr/bin/python
# -*- coding:utf-8 -*-
import numpy as np
import matplotlib.pyplot as plt
from matplotlib import colors

from sklearn.discriminant_analysis import QuadraticDiscriminantAnalysis

file1 = open(\'c:\\quant\\watermelon.csv\',\'r\')
data = [line.strip(\'\\n\').split(\',\') for line in file1]
X = [[float(raw[-3]), float(raw[-2])] for raw in data[1:]]
y = [1 if raw[-1]==\'\\xca\\xc7\' else 0 for raw in data[1:]]
X = np.array(X)
y = np.array(y)

#######################################################################以上是西瓜

# colormap
cmap = colors.LinearSegmentedColormap(
    \'red_blue_classes\',
    {\'red\': [(0, 1, 1), (1, 0.7, 0.7)],
     \'green\': [(0, 0.7, 0.7), (1, 0.7, 0.7)],
     \'blue\': [(0, 0.7, 0.7), (1, 1, 1)]})
plt.cm.register_cmap(cmap=cmap)

###############################################################################
# plot functions
def plot_data(lda, X, y, y_pred):
    plt.figure()
    plt.title(\'Quadratic Discriminant Analysis of Watermelon\')
    plt.xlabel(\'Sugar Rate\')
    plt.ylabel(\'Density\')
    tp = (y == y_pred)  # True Positive //Boolean matrix

    tp0, tp1 = tp[y == 0], tp[y == 1]
    print tp
    X0, X1 = X[y == 0], X[y == 1]
    X0_tp, X0_fp = X0[tp0], X0[~tp0]
    X1_tp, X1_fp = X1[tp1], X1[~tp1]
    # class 0: dots
    plt.plot(X0_tp[:, 0], X0_tp[:, 1], \'o\', color=\'red\')
    plt.plot(X0_fp[:, 0], X0_fp[:, 1], \'.\', color=\'#990000\')  # dark red

    # class 1: dots
    plt.plot(X1_tp[:, 0], X1_tp[:, 1], \'o\', color=\'blue\')
    plt.plot(X1_fp[:, 0], X1_fp[:, 1], \'.\', color=\'#000099\')  # dark blue

    # class 0 and 1 : areas
    nx, ny = 200, 100
    x_min, x_max = plt.xlim()
    y_min, y_max = plt.ylim()
    xx, yy = np.meshgrid(np.linspace(x_min, x_max, nx),
                         np.linspace(y_min, y_max, ny))
    Z = lda.predict_proba(np.c_[xx.ravel(), yy.ravel()])
    Z = Z[:, 1].reshape(xx.shape)
    plt.pcolormesh(xx, yy, Z, cmap=\'red_blue_classes\',
                   norm=colors.Normalize(0., 1.))
    plt.contour(xx, yy, Z, [0.5], linewidths=2., colors=\'k\')

    # means
    plt.plot(lda.means_[0][0], lda.means_[0][1],
             \'o\', color=\'black\', markersize=10)
    plt.plot(lda.means_[1][0], lda.means_[1][1],
             \'o\', color=\'black\', markersize=10)

###############################################################################
# Linear Discriminant Analysis
qda = QuadraticDiscriminantAnalysis(store_covariances=True)
y_pred = qda.fit(X, y).predict(X)
plot_data(qda, X, y, y_pred)
plt.axis(\'tight\')
plt.suptitle(\'Quadratic Discriminant Analysis of Watermelon\')
plt.show()
二次判别分析结果和线性判别分析结果分别如下:


可以看到对于线性不可分数据,二次判别分析的效果非常好。
以上是关于《机器学习》周志华 习题答案3.6的主要内容,如果未能解决你的问题,请参考以下文章