Cycle Indicator Functions周期指标函数
Posted wintalau
tags:
篇首语:本文由小常识网(cha138.com)小编为大家整理,主要介绍了Cycle Indicator Functions周期指标函数相关的知识,希望对你有一定的参考价值。
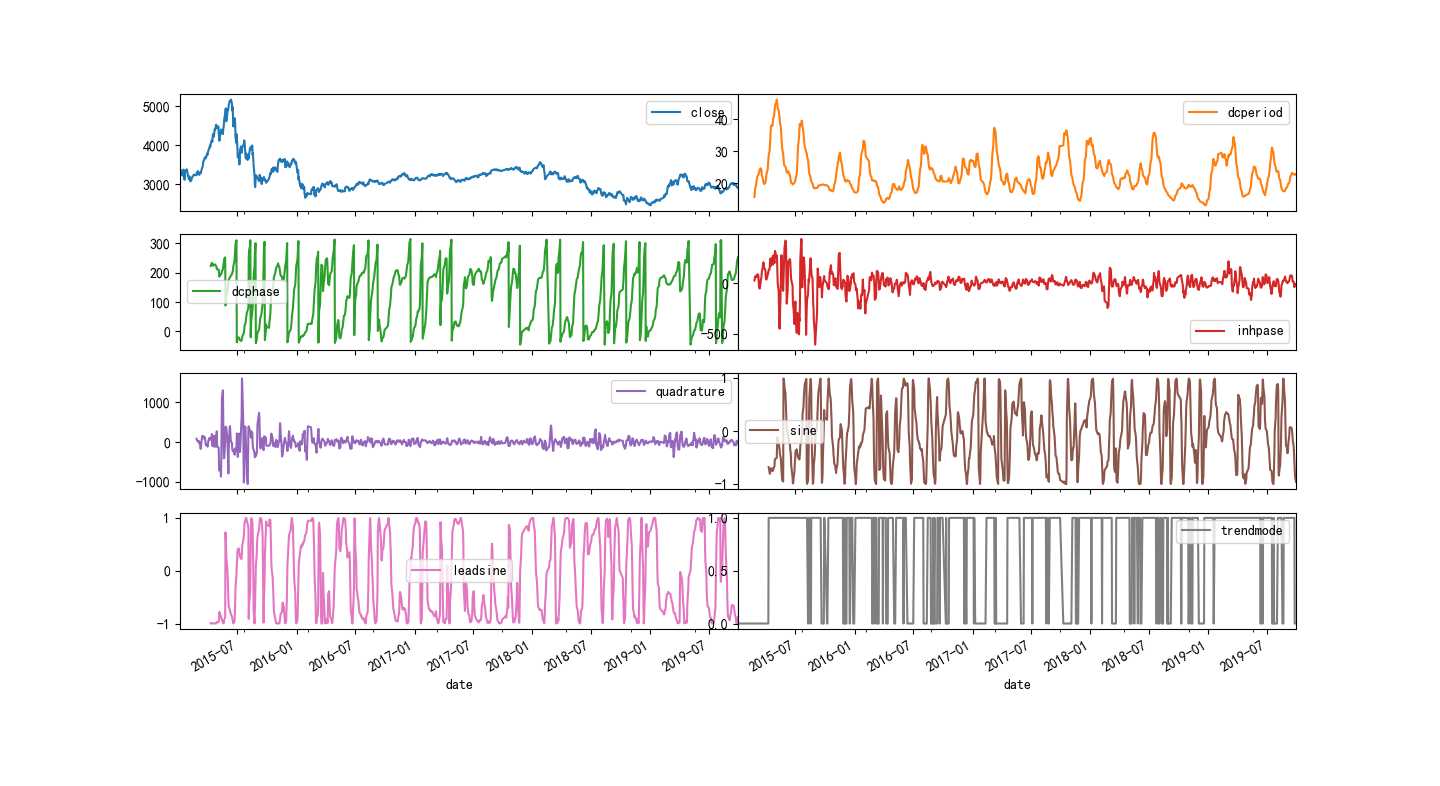
希尔伯特变换(Hilbert Transform)是积分变换中的一种,在信号处理领域得到了广泛的应用,而在工程中常用于窄带数字信号的处理。金融市场的波动是非周期、不规律的,但只要存在波动,就可以通过希尔伯特变换寻找其“周期性”。对于股价走势,一般可将其分解为:长期趋势、中短期周期性波动和噪声。在去除长期趋势的情况下,可以利用希尔伯特变换对中短期的周期性波动进行分析。
HT_DCPERIOD: Hilbert Transform-Dominant Cycle Period 希尔伯特变换-主导周期:
ta.HT_DCPERIOD(close),计算价格的周期位置,用作择时的依据。
HT_DCPHASE: Hilbert Transform-Dominant Cycle Phase 希尔伯特变换-主导循环阶段:
ta.HT_DCPHASE(close)
HT_PHASOR: Hilbert Transform-Phasor Components 希尔伯特变换-相位构成:
inphase, quadrature = ta.HT_PHASOR(close), 分解为同相分量和正交分量
HT_SINE: Hilbert Transform-SineWave 希尔伯特变换-正弦波:
sine, leadsine = ta.HT_SINE(close)
HT_TRENDMODE: Hilbert Transform-Trend vs Cycle Mode 希尔伯特变换-趋势与周期模式
ta.HT_TRENDMODE(close)
import pandas as pd
import numpy as np
import matplotlib.pyplot as plt
import talib as ta
import tushare as ts

plt.rcParams[‘font.sans-serif‘] = [‘SimHei‘]
plt.rcParams[‘axes.unicode_minus‘] = False

def get_data(code, start=‘2015-01-01‘):
    df = ts.get_k_data(code, start)
    df.index = pd.to_datetime(df.date)
    df = df.sort_index()
    return df

df = get_data(‘sh‘)[[‘open‘,‘close‘,‘high‘,‘low‘]]
df[‘dcperiod‘] = ta.HT_DCPERIOD(df.close)
df[‘dcphase‘] = ta.HT_DCPHASE(df.close)
df[‘inhpase‘], df[‘quadrature‘] = ta.HT_PHASOR(df.close)
df[‘sine‘], df[‘leadsine‘] = sine, leadsine = ta.HT_SINE(df.close)
df[‘trendmode‘] = ta.HT_TRENDMODE(df.close)

df[[‘close‘,‘dcperiod‘,‘dcphase‘,‘inhpase‘,
    ‘quadrature‘,‘sine‘,‘leadsine‘,‘trendmode‘]
    ].plot(figsize=(20,18), subplots=True, layout=(4,2))
plt.subplots_adjust(wspace=0, hspace=0.2)

sdafsd
以上是关于Cycle Indicator Functions周期指标函数的主要内容,如果未能解决你的问题,请参考以下文章