Echarts入门
Posted unpro-mercy
tags:
篇首语:本文由小常识网(cha138.com)小编为大家整理,主要介绍了Echarts入门相关的知识,希望对你有一定的参考价值。
入门指南
官网:https://echarts.apache.org/zh/index.html
文档:https://echarts.apache.org/zh/tutorial.html#5%20%E5%88%86%E9%92%9F%E4%B8%8A%E6%89%8B%20ECharts
下载:https://echarts.apache.org/zh/download.html
实例:https://echarts.apache.org/examples/zh/index.html
参考:https://www.jianshu.com/p/3cf80b96a65d
好看的:https://gallery.echartsjs.com/editor.html?c=xHyz853kSx
入门案例
- 搞个div用来专门显示图表
- div一定要有高度宽度
- 按照写法把数据搞进去
- 各种颜色,各种大小,各种位置,按需修改
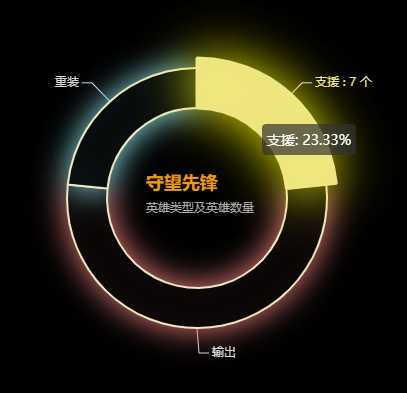
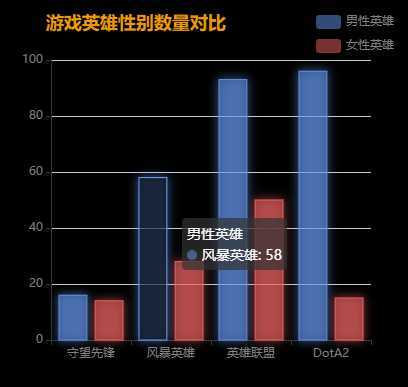
以下数据纯属虚构。

<!DOCTYPE html> <html lang="zh-cn"> <head> <title>EChartsTest</title> <meta charset="utf-8" /> <script src="echarts.min.js"></script> </head> <body> <div id="pie1" style="float:left;width:400px;height:400px;"></div> <div id="bar1" style="float:left;width:400px;height:400px;"></div> <div id="1" style="float:left;width:400px;height:400px;"></div> <script type="text/javascript"> var pie1 = echarts.init(document.getElementById(‘pie1‘)); var pie1Option = title: text:"守望先锋", textStyle: color:‘#EE9A00‘, fontSize:18 , subtext: ‘英雄类型及英雄数量‘, left:"36%", top:"43%", , backgroundColor:‘black‘, tooltip: formatter:"b: d%" , series:[ name:‘守望先锋英雄类型‘, type:‘pie‘, //radius:‘60%‘, radius : [‘45%‘, ‘65%‘], data:[ value:7,name:‘支援‘, itemStyle: normal: borderColor:‘#EEE9BF‘, shadowColor: ‘#EEEE00‘, , emphasis: color:‘#EEE685‘, borderColor:‘#EEE685‘, shadowColor: ‘#EEEE00‘, , label: emphasis: textStyle: color:‘#EEE685‘ , labelLine: emphasis: lineStyle: color:‘#EEE685‘ , value:16,name:‘输出‘, itemStyle: normal: borderColor:‘#EEE9BF‘, shadowColor: ‘#F08080‘, , emphasis: color:‘#F08080‘, borderColor:‘#F08080‘, shadowColor: ‘#F08080‘, , label: emphasis: textStyle: color:‘#F08080‘ , labelLine: emphasis: lineStyle: color:‘#F08080‘ , value:7,name:‘重装‘, itemStyle: normal: borderColor:‘#EEE9BF‘, shadowColor: ‘#8EE5EE‘, , emphasis: color:‘#8EE5EE‘, borderColor:‘#8EE5EE‘, shadowColor: ‘#8EE5EE‘, , label: emphasis: formatter: "b : c 个", textStyle: color:‘#8EE5EE‘ , labelLine: emphasis: lineStyle: color:‘#8EE5EE‘ ], //roseType:‘angle‘, itemStyle: normal: color:‘black‘, borderWidth:2, shadowBlur: 30 , emphasis: borderWidth:3, shadowBlur: 50 , label: normal: textStyle: color:‘#D6D6D6‘ , emphasis: formatter: "b : c 个" , labelLine: normal: length: 25, length2: 10, lineStyle: color:‘#D6D6D6‘ ] ; pie1.setOption(pie1Option ); var bar1 = echarts.init(document.getElementById(‘bar1‘)); var bar1Option = title: text:‘游戏英雄性别数量对比‘, textStyle: color:‘#EE9A00‘ , left:30, top:10 , backgroundColor:‘black‘, tooltip: , legend: left:‘75%‘, top:10, textStyle: color:‘grey‘ , xAxis: type: ‘category‘, //axisTick: show: false, data: ["守望先锋","风暴英雄","英雄联盟","DotA2"], axisLabel: textStyle:color:‘grey‘ , yAxis: type:‘value‘, axisLabel: textStyle:color:‘grey‘ , series: [ name: ‘男性英雄‘, type: ‘bar‘, data: [16,58,93,96], itemStyle: normal: color:‘rgba(100,149,237,0.5)‘, borderColor:‘#6495ED‘, shadowColor:‘#6495ED‘, shadowBlur:10 , emphasis: color:‘rgba(0,0,0,0.5)‘ , labelLine: emphasis: , name: ‘女性英雄‘, type: ‘bar‘, data: [14,28,50,15], itemStyle: normal: color:‘rgba(240,100,100,0.5)‘, borderColor:‘#F06464‘, shadowColor:‘#F06464‘, shadowBlur:10 , emphasis: color:‘rgba(0,0,0,0.5)‘, shadowBlur:30 , labelLine: emphasis: ] ; bar1.setOption(bar1Option); </script> </body> </html>
进阶案例
百度地图+Echarts(大数据前端雏形)
点击图表,在百度地图勾勒区域轮廓、填色、移动视野
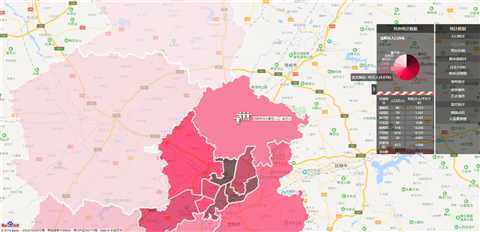
点击图表,在百度地图勾勒区域轮廓、填色、移动视野、弹出自定义信息窗口、显示图表
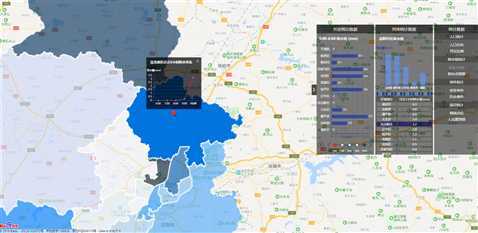
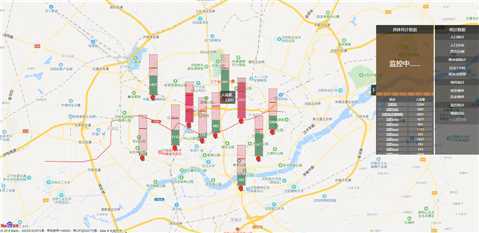
点击图表,在百度地图勾勒区域轮廓、填色、移动视野、弹出带搜索的信息窗口、显示自定义信息
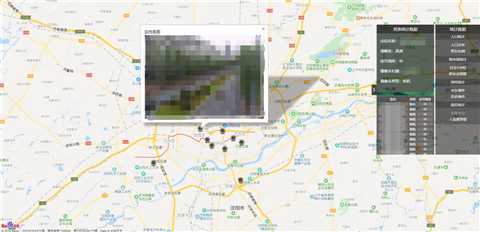
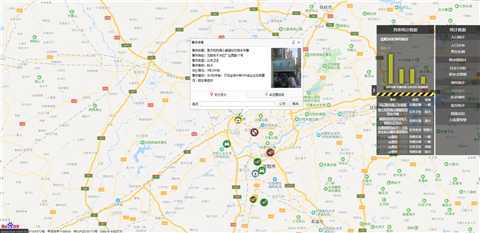 在百度地图点击自定义标记、弹出带信息窗口、播放视频
以上是关于Echarts入门的主要内容,如果未能解决你的问题,请参考以下文章
