php-xdebug配置使用
Posted hanpengyu
tags:
篇首语:本文由小常识网(cha138.com)小编为大家整理,主要介绍了php-xdebug配置使用相关的知识,希望对你有一定的参考价值。
简要说明
简单的记录一下php-xdebug的配置,主要实现通过浏览器的插件配合phpstorm来进行断点调试,单步,以及通过xdebug来生成性能分析报告。
1.php-xdebug扩展的安装相对来说很简单,主要是通过apt-get、yum、pecl,或者直接通过编译的方式来进行安装都可以,很容易。
2.浏览器插件的安装,这次主要是使用chrome的xdebug-helper插件
3.phpstorm的配置
php.ini文件的修改
[xdebug]
;断点调试
xdebug.remote_enable=On ;远程调试
xdebug.remote_autostart=On ;开启远程调试自动启动
xdebug.remote_host=192.168.33.1
xdebug.remote_port=9001
xdebug.auto_trace=on ;启用代码自动跟踪
xdebug.collect_vars=On ;收集变量
xdebug.collect_return=On ;收集返回值
xdebug.collect_params=On ;收集参数
xdebug.idekey=hanpy
xdebug.remote_log="/tmp/xdebug.log"
;性能分析
xdebug.profiler_enable=On ;启用性能检测分析
;xdebug.trace_output_dir="/tmp/xdebug_profiler" ;指定堆栈跟踪文件的存放目录
xdebug.profiler_output_dir="/tmp/xdebug_profiler" ;指定性能分析文件的存放目录
xdebug.profiler_output_name="cachegrind.out.%p"
xdebug.profiler_enable_trigger=1
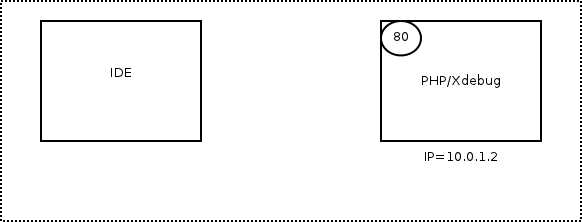
xdebug官网有一个原理图,放上来记录一下
1?? The IP of the server is 10.0.1.2 with HTTP on port 80
2?? The IDE is on IP 10.0.1.42, so xdebug.remote_host is set to 10.0.1.42
3?? The IDE listens on port 9000, so xdebug.remote_port is set to 9000
4?? The HTTP request is started on the machine running the IDE
5?? Xdebug connects to 10.0.1.42:9000
6?? Debugging runs, HTTP Response provided
1?? The IP of the server is 10.0.1.2 with HTTP on port 80
2?? The IDE is on an unknown IP, so xdebug.remote_connect_back is set to 1
3?? The IDE listens on port 9000, so xdebug.remote_port is set to 9000
4?? The HTTP request is made, Xdebug detects the IP addres from the HTTP headers
5?? Xdebug connects to the detected IP (10.0.1.42) on port 9000
6?? Debugging runs, HTTP Response provided

phpstorm的配置
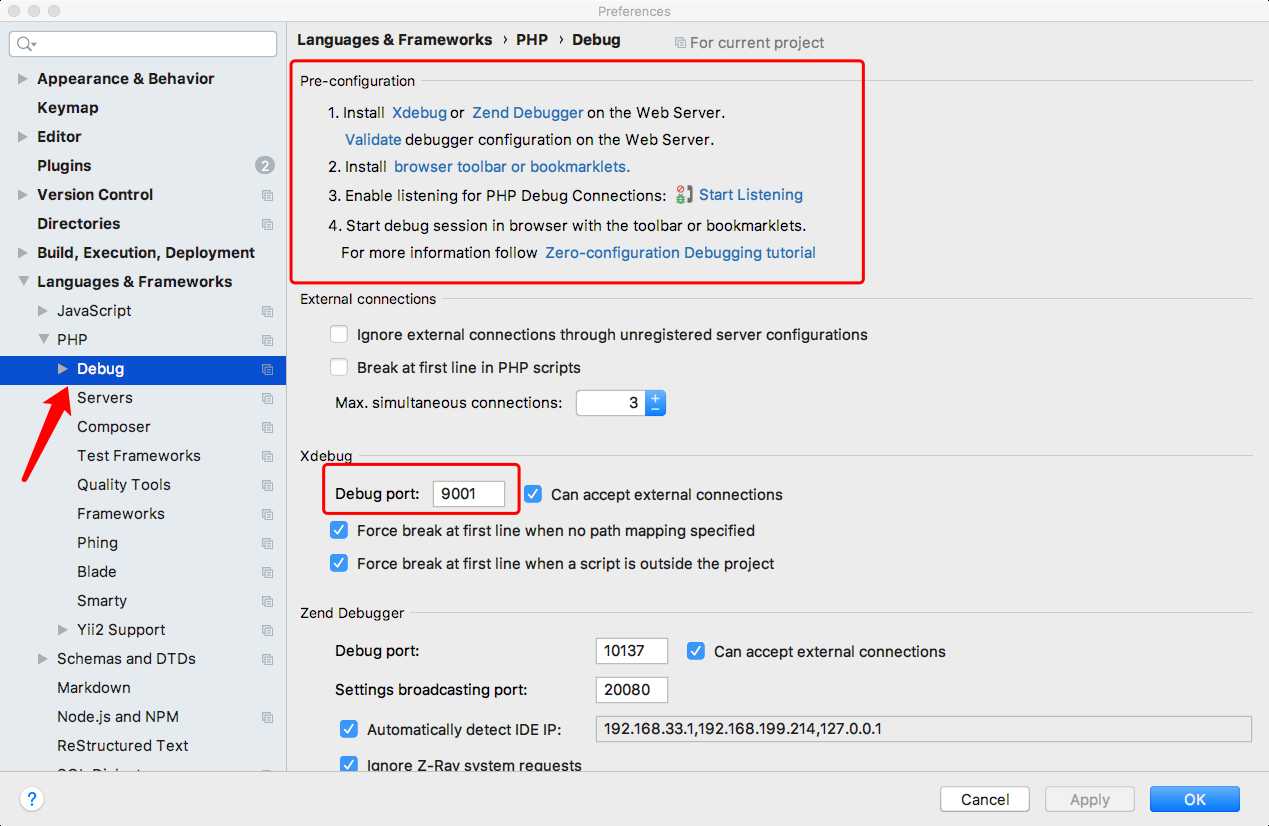
1.首先配置phpstorm的Debug,只有一个地方需要配置就是 Debug port 端口。在Pre-configuration中已经清晰的写明白了步骤
1?? 安装Xdebug
2?? 验证配置
3?? 安装浏览器插件
4?? 开启phpstorm的Debug监听
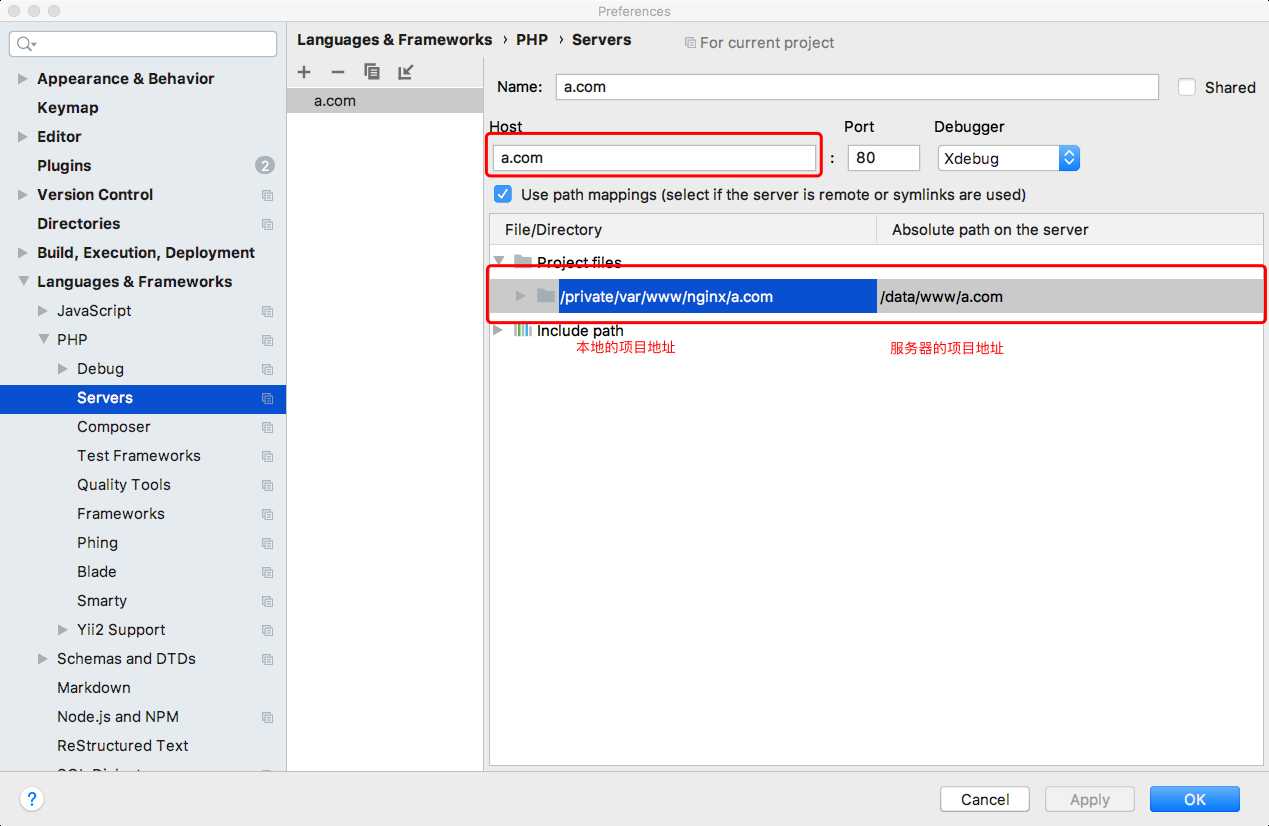
2.配置phpstorm的Debug Servers
1?? 配置host,项目的host
2?? 配置文件目录的映射,就是本地文件和服务器文件的映射
3.开启监听就可以了

4.最后就是要配置浏览器插件了。在前面的php.ini中有一个配置xdebug.idekey,需要把这个key配置到浏览器插件中,然后就可以开始单步调试了。
在浏览器中访问a.com,然后在项目中打断点,phpstorm就可以监听到。
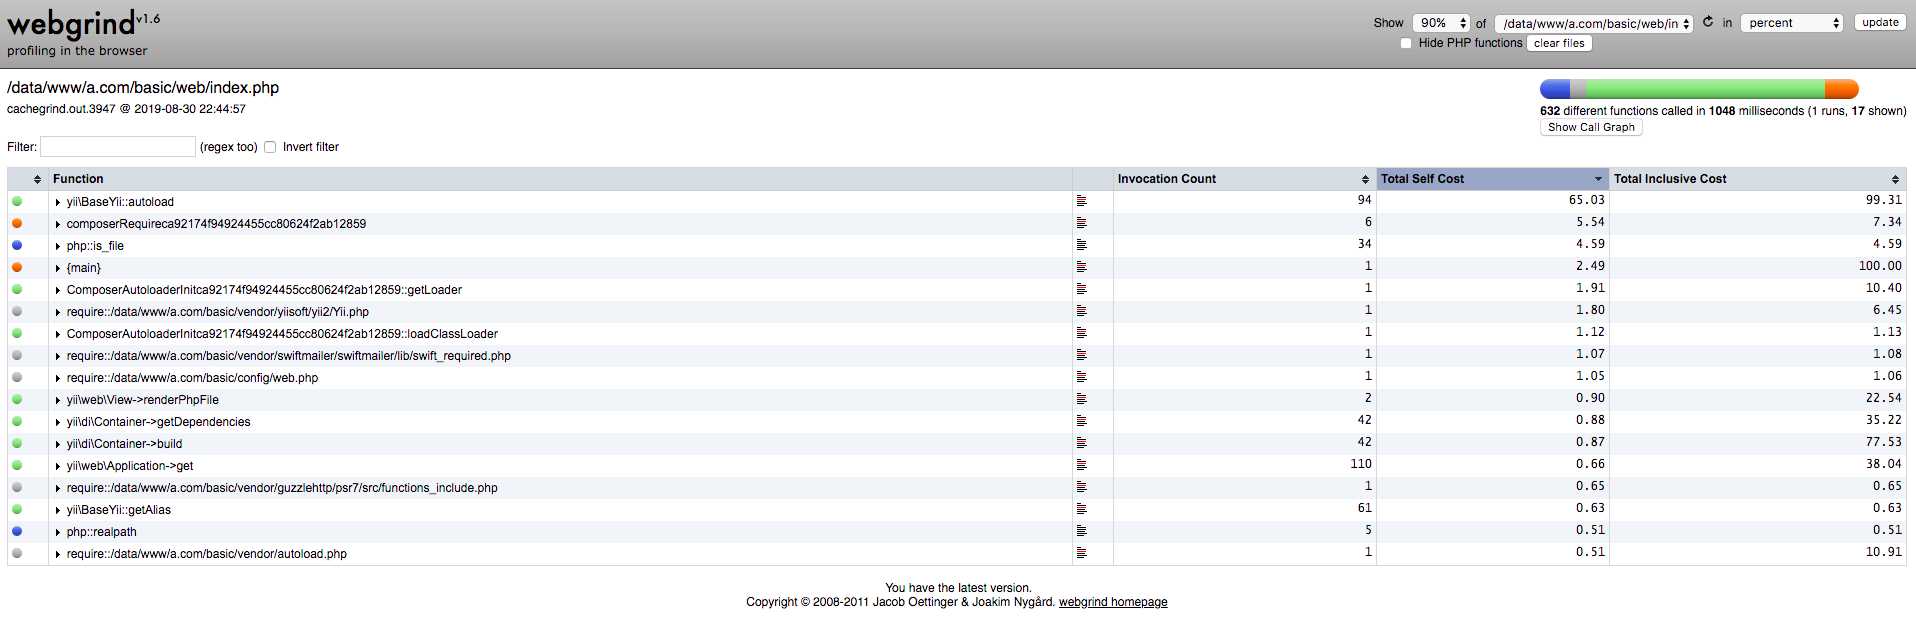
性能报告文件的生成xdebg官网:
https://xdebug.org
生成性能报告需要
https://github.com/jokkedk/webgrind/
https://github.com/jrfonseca/gprof2dot
gprof2dot安装
yum install python3 graphviz
yum 源没有3,特么的……,手动来吧……
wget http://www.python.org/ftp/python/3.3.0/Python-3.3.0.tgz
tar -xzvf Python-3.3.0.tgz
cd Python-3.3.0
./configure --prefix=/usr/local/python3
make
make install
安装好之后给webgrind配置一个虚拟主机,直接访问就可以了,这个就比较简单了,忘记了可以看一下github里面的文档。
安装好之后要修改一下webgrind的配置文件,把python的路径修改一下,这样才能生成性能报告的那个图。
性能报告文件是这样的
以上是关于php-xdebug配置使用的主要内容,如果未能解决你的问题,请参考以下文章