numpy绘制利萨茹曲线
Posted draven123
tags:
篇首语:本文由小常识网(cha138.com)小编为大家整理,主要介绍了numpy绘制利萨茹曲线相关的知识,希望对你有一定的参考价值。
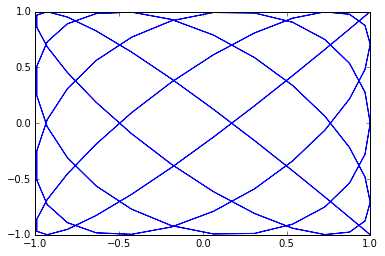
利萨茹曲线
参数方程定义:

Key_Function
np.sin函数, 生成sin正弦函数
Code
import numpy as np
import matplotlib.pyplot as plt

a = 8
b = 9
t = np.linspace(-np.pi, np.pi, 201)
x = np.sin(a *t + np.pi/2)
y = np.sin(b * t)

plt.plot(x, y)
plt.show()

Code
import numpy as np
import matplotlib.pyplot as plt

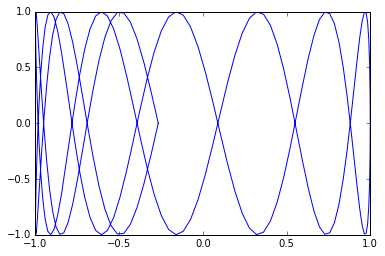
a = np.sqrt(2)
b = 9
t = np.linspace(-np.pi, np.pi, 201)

x = np.sin(a * t + np.pi/2)
y = np.sin(b * t)

plt.plot(x, y)
plt.show()

以上是关于numpy绘制利萨茹曲线的主要内容,如果未能解决你的问题,请参考以下文章