python pandas 直方图
Posted wanderingfish
tags:
篇首语:本文由小常识网(cha138.com)小编为大家整理,主要介绍了python pandas 直方图相关的知识,希望对你有一定的参考价值。
import matplotlib.pyplot as plt
import numpy as np
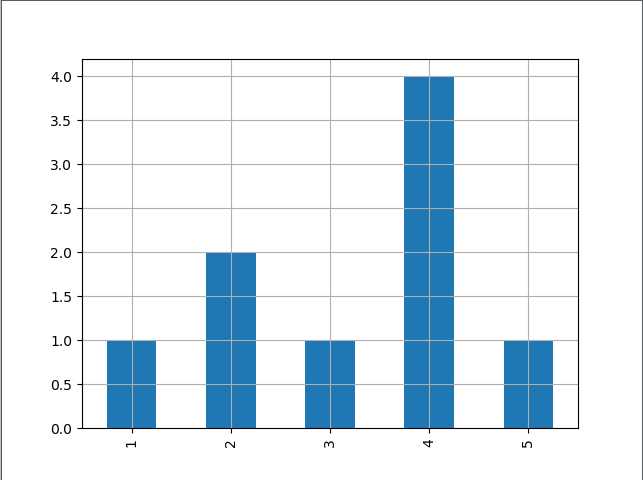
df2 = pd.Series([1,2,1,4,1],index=[1,2,3,4,5]) #
print(df2)
#df2.plot()
df=pd.DataFrame(1:[1,1,4,3],2:[1,2,3,4])
#pd.DataFrame.hist(df,column=[1])
#a=df.hist(orientation="vertical",histtype="stepfilled")
#fig, ax = plt.subplots()
df2.plot(grid=True,kind="bar",use_index=True) # 使用pd.Series 中的index坐位x轴 使用 use_index 默认是True
#pd.Series.hist(df2)
#df2.plot(kind="bar") # kind指定类型 kind="hist" 相当于 pd.Series.hist(df2)  叠加图形 df2 = pd.Series([1,2,1,4,1]), 1有3个, 1的纵轴就是3格,  2,4就是1 格
plt.show()
###############
 kind : str
        - 'line' : line plot (default)
        - 'bar' : vertical bar plot
        - 'barh' : horizontal bar plot
        - 'hist' : histogram
        - 'box' : boxplot
        - 'kde' : Kernel Density Estimation plot
        - 'density' : same as 'kde'
        - 'area' : area plot
        - 'pie' : pie plot
        - 'scatter' : scatter plot
        - 'hexbin' : hexbin plot
    Make plots of Series or DataFrame using the backend specified by the
    option ``plotting.backend``. By default, matplotlib is used.

    Parameters
    ----------
    data : Series or DataFrame
        The object for which the method is called
    x : label or position, default None
        Only used if data is a DataFrame.
    y : label, position or list of label, positions, default None
        Allows plotting of one column versus another. Only used if data is a
        DataFrame.
    kind : str
        - 'line' : line plot (default)
        - 'bar' : vertical bar plot
        - 'barh' : horizontal bar plot
        - 'hist' : histogram
        - 'box' : boxplot
        - 'kde' : Kernel Density Estimation plot
        - 'density' : same as 'kde'
        - 'area' : area plot
        - 'pie' : pie plot
        - 'scatter' : scatter plot
        - 'hexbin' : hexbin plot
    figsize : a tuple (width, height) in inches
    use_index : bool, default True
        Use index as ticks for x axis
    title : string or list
        Title to use for the plot. If a string is passed, print the string
        at the top of the figure. If a list is passed and `subplots` is
        True, print each item in the list above the corresponding subplot.
    grid : bool, default None (matlab style default)
        Axis grid lines
    legend : False/True/'reverse'
        Place legend on axis subplots
    style : list or dict
        matplotlib line style per column
    logx : bool or 'sym', default False
        Use log scaling or symlog scaling on x axis
        .. versionchanged:: 0.25.0

    logy : bool or 'sym' default False
        Use log scaling or symlog scaling on y axis
        .. versionchanged:: 0.25.0

    loglog : bool or 'sym', default False
        Use log scaling or symlog scaling on both x and y axes
        .. versionchanged:: 0.25.0

    xticks : sequence
        Values to use for the xticks
    yticks : sequence
        Values to use for the yticks
    xlim : 2-tuple/list
    ylim : 2-tuple/list
    rot : int, default None
        Rotation for ticks (xticks for vertical, yticks for horizontal
        plots)
    fontsize : int, default None
        Font size for xticks and yticks
    colormap : str or matplotlib colormap object, default None
        Colormap to select colors from. If string, load colormap with that
        name from matplotlib.
    colorbar : bool, optional
        If True, plot colorbar (only relevant for 'scatter' and 'hexbin'
        plots)
    position : float
        Specify relative alignments for bar plot layout.
        From 0 (left/bottom-end) to 1 (right/top-end). Default is 0.5
        (center)
    table : bool, Series or DataFrame, default False
        If True, draw a table using the data in the DataFrame and the data
        will be transposed to meet matplotlib's default layout.
        If a Series or DataFrame is passed, use passed data to draw a
        table.
    yerr : DataFrame, Series, array-like, dict and str
        See :ref:`Plotting with Error Bars <visualization.errorbars>` for
        detail.
    xerr : DataFrame, Series, array-like, dict and str
        Equivalent to yerr.
    mark_right : bool, default True
        When using a secondary_y axis, automatically mark the column
        labels with "(right)" in the legend
    `**kwds` : keywords
        Options to pass to matplotlib plotting method

    Returns
    -------
    :class:`matplotlib.axes.Axes` or numpy.ndarray of them
        If the backend is not the default matplotlib one, the return value
        will be the object returned by the backend.

    Notes
    -----
    - See matplotlib documentation online for more on this subject
    - If `kind` = 'bar' or 'barh', you can specify relative alignments
      for bar plot layout by `position` keyword.
      From 0 (left/bottom-end) to 1 (right/top-end). Default is 0.5
      (center)
以上是关于python pandas 直方图的主要内容,如果未能解决你的问题,请参考以下文章