在WPF中嵌入WebBrowser可视化页面
Posted zaranet
tags:
篇首语:本文由小常识网(cha138.com)小编为大家整理,主要介绍了在WPF中嵌入WebBrowser可视化页面相关的知识,希望对你有一定的参考价值。
无论是哪种C/S技术,涉及数据可视化就非常的累赘了,当然大神也一定有,只不过面向大多数人,还是通过网页来实现,有的时候不想把这两个功能分开,一般会是客户的原因,所以我们打算在WPF中嵌入WebBrowser,然后使用ECharts 完成复杂的图表展示,其功能不亚于一个名为Devexpress的图标库,而且这东西还收费(呵呵),本文就对WebBrowser+ECharts进行了演示。
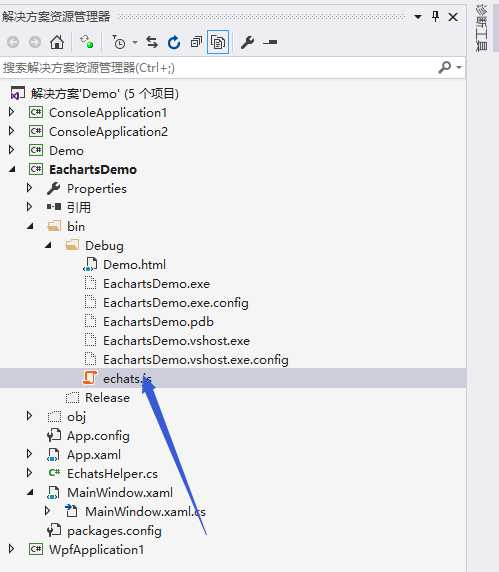
首先下载一下Echats.js文件以及Jquery文件并且创建一个html页面,在我们项目的bin文件夹中。

在html中编辑,其中包括了几个方法,是对C#代码进行访问的。
<!DOCTYPE html>
<html lang="zh-cn" xmlns="http://www.w3.org/1999/xhtml">
<!-- saved from url=(0013)about:internet -->
<head>
    <meta charset="utf-8" http-equiv="X-UA-Compatible" content="IE=5,6,7,8,9,10,11, chrome=1" />
    <title>ECharts</title>
</head>
<body>
    <h1>html页面</h1>
    <button Onclick="click1()" style="width:100px;height:20px">测试</button>
    <script>
        function click1()

            window.external.ShowMsg("这是一条信息");

    </script>
    <div id="main" style="width:1000px;height:500px;margin-left:-8px" />
    <script src="echats.js"></script>
    <script src="https://code.jquery.com/jquery-3.1.1.min.js"></script>
    <script>
        myChart = echarts.init(document.getElementById(‘main‘));
        option =
            xAxis:
                type: ‘category‘,
                data: [‘Mon‘, ‘Tue‘, ‘Wed‘, ‘Thu‘, ‘Fri‘, ‘Sat‘, ‘Sun‘]
            ,
            yAxis:
                type: ‘value‘
            ,
            series: [
                data: [820, 932, 901, 934, 1290, 1330, 1320],
                type: ‘line‘
            ]
        ;
        myChart.setOption(option);
    </script>
    <script>
        function SetOption(value)
            var dataObj = JSON.parse(value);//将字符串转换为json对象
            myChart.setOption(JSON.parse(dataObj));//将json对象转换为[Object]

        function jsShowHide(info)
            if (info == 0)
                myChart.clear();

            else
                myChart.setOption(option);


        function jsPushData(x, y)
            option.xAxis.data.push(x);
            option.series[0].data.push(y);
            myChart.setOption(option);

    </script>
</body>
</html>
现在我们需要编辑一下我们的WPF窗体,在其中放入我们的浏览器,然后让它显示我们刚刚写好的页面。
<Window x:Class="EachartsDemo.MainWindow"
        xmlns="http://schemas.microsoft.com/winfx/2006/xaml/presentation"
        xmlns:x="http://schemas.microsoft.com/winfx/2006/xaml"
        xmlns:d="http://schemas.microsoft.com/expression/blend/2008"
        xmlns:mc="http://schemas.openxmlformats.org/markup-compatibility/2006"
        xmlns:local="clr-namespace:EachartsDemo"
        mc:Ignorable="d"
        Title="MainWindow" Height="350" Width="525" Loaded="Window_Loaded">
    <Grid>
        <Grid.RowDefinitions>
            <RowDefinition Height="50"></RowDefinition>
            <RowDefinition></RowDefinition>
            <RowDefinition Height="100"></RowDefinition>
        </Grid.RowDefinitions>
        <TextBlock Grid.Row="0" Text="webBrowser" HorizontalAlignment="Center" VerticalAlignment="Center" FontSize="25"></TextBlock>
        <WebBrowser Grid.Row="1" Name="Web"></WebBrowser>
        <StackPanel Grid.Row="2" Orientation="Horizontal" VerticalAlignment="Center">
            <TextBlock Text="wpf按钮: " FontSize="20"></TextBlock>
            <Button Grid.Row="2" Name="btnShowHide" Content="加载"  Click="btnShowHide_Click"></Button>
            <Button Grid.Row="2" Name="btnAddSeries" Content="追加" Margin="10,0,0,0" Click="btnPushData_Click"></Button>
            <Button Grid.Row="2" Name="btnSet" Content="重置" Margin="10,0,0,0" Click="SetOption">
            </Button>
        </StackPanel>
    </Grid>
</Window>
在Windows标记中我们需要一个Load事件用于让WebBrowser跳转到相应的页面。
private void Window_Loaded(object sender, RoutedEventArgs e)

            Web.Navigate(new Uri(Directory.GetCurrentDirectory() + "/Demo.html"));
最后我们还需要创建几个方法,用于让C#直接调用其中Js方法。
int show = 0;
        private void btnShowHide_Click(object sender, RoutedEventArgs e)

            Web.InvokeScript("jsShowHide", show);
            if (show == 0) show = 1;
            else show = 0;


        private void btnPushData_Click(object sender, RoutedEventArgs e)

            Web.InvokeScript("jsPushData", "x", 1000,"y","200");


        private void SetOption(object sender, RoutedEventArgs e)

            string strobj = @"""xAxis"":""type"":""category"",""data"":[""Mon"",""Tue"",""Wed"",""Thu"",""Fri"",""Sat"",""Sun""],""yAxis"":""type"":""value"",""series"":[""data"":[100,200,300,400,500,600,700],""type"":""line""]";
            var aa = JsonConvert.SerializeObject(strobj.Trim());
                Web.InvokeScript("SetOption",aa);
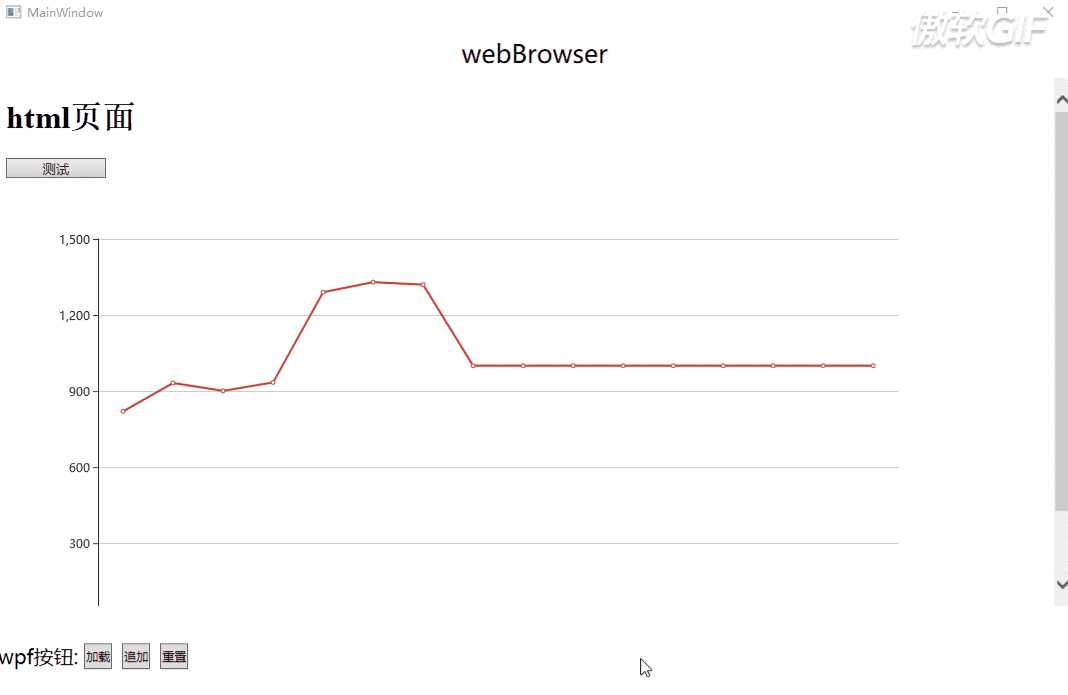
因为我们在xaml中把WebBrowser的name改成了Web,其中这个控件自带一个InvokeScript方法,就是来使用页面写好的Function,就这样启动~

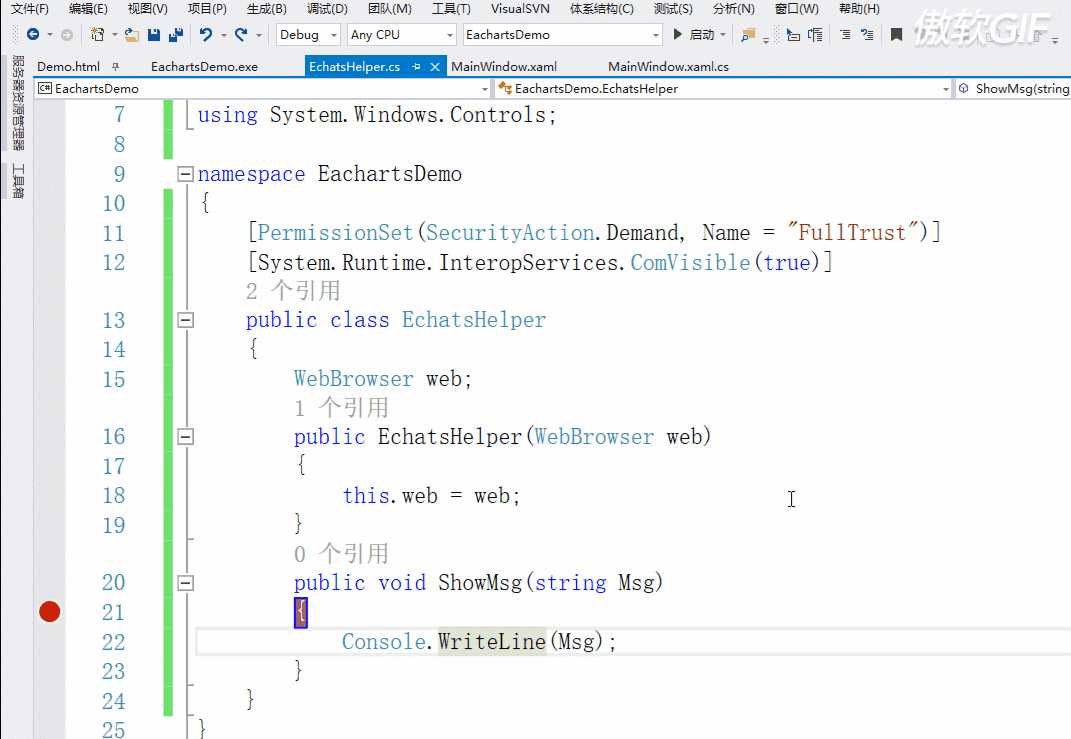
可见效果还可以,就现在我们要通过Js调用C#方法,首先编辑一个页面可操作的类,我们创建 EchatsHelper ,必须在类上面标注特性,否则程序启动不起来,因为WebBrowser是涉及一些安全性的东西,只要是在哪个类new出来,就必须在哪个类标注特性。
[PermissionSet(SecurityAction.Demand, Name = "FullTrust")]
    [System.Runtime.InteropServices.ComVisible(true)]//给予权限并设置可见
    public class EchatsHelper

        WebBrowser web;
        public EchatsHelper(WebBrowser web)

            this.web = web;

        public void ShowMsg(string Msg)

            Console.WriteLine(Msg);
最后我们在Load事件中创建应用程序对文档文件的寄宿脚本访问。
private void Window_Loaded(object sender, RoutedEventArgs e)

            Web.ObjectForScripting = new EchatsHelper(Web);
            Web.Navigate(new Uri(Directory.GetCurrentDirectory() + "/Demo.html"));
就这样~我们测试一下~

以上是关于在WPF中嵌入WebBrowser可视化页面的主要内容,如果未能解决你的问题,请参考以下文章