Srping boot + ECharts 简单应用
Posted kuangbiwei
tags:
篇首语:本文由小常识网(cha138.com)小编为大家整理,主要介绍了Srping boot + ECharts 简单应用相关的知识,希望对你有一定的参考价值。
在做个项目中,项目要求做个折线图显示统计在线人数,(统计人数保存在数据库中),以前没有做过折线图,在网上找了
百度出品的 ECharts,看了几天文档后测试了下(因为网上的官网写的文档很是简单,),随后研究了下,完成了,现在写个简单的前后端交互,代码如下:

第一步:
获取Echarts
从官网下载界面选择你需要的版本下载,根据开发者功能和体积上的需求,我们提供了不同打包的下载,如果你在体积上没有要求,可以直接下载完整版本。开发环境建议下载源代码版本 (我用的是源代码版)
第二步:前端页面 加 ajax
<!DOCTYPE html>
<html>
<head>
    <meta charset="utf-8">
    <!-- 引入 ECharts 文件 -->
    <script src="../../js/echarts.min.js"></script>
    <script src="../../js/jquery-2.1.3.js"></script>
</head>

<body>
    <!-- 为 ECharts 准备一个具备大小(宽高)的 DOM -->
    <div id="main" style="width: 600px;height:400px;"></div>

    <script type="text/javascript">

        // 基于准备好的dom,初始化echarts实例
        var myChart = echarts.init(document.getElementById(‘main‘));
        // 指定图表的配置项和数据
        var names=[];
        var values=[];

        //数据加载完之前先显示一段简单的loading动画
        myChart.showLoading();

        //异步请求
        $.ajax(
            type : "post",
            async : true,            //异步请求(同步请求将会锁住浏览器,用户其他操作必须等待请求完成才可以执行)
            url : "/EcharsShow",    //请求发送到dataActiont处
            data : ,
            dataType : "json",        //返回数据形式为json
            success : function(result)
                //请求成功时执行该函数内容,result即为服务器返回的json对象
                if (result)
                    for(var i=0;i<result.length;i++)
                        names.push(result[i].time);
                        values.push(result[i].number);

                    myChart.hideLoading();    //隐藏加载动画
                    //加载显示的折线图
                    myChart.setOption(

                            title:
                                text: ‘登陆人数统计‘
                            ,
                            tooltip: ,
                            legend:
                                data: [‘人数‘]
                            ,
                            xAxis:
                                data: names
                            ,
                            yAxis:
                            ,
                            series: [

                                    name: ‘登陆人数‘,
                                    type: ‘line‘,
                                    data: values


                            ]

                    );

            ,
            error : function(errorMsg)
                //请求失败时执行该函数
                alert("图表请求数据失败!");
                myChart.hideLoading();

        );//end ajax

    </script>
</body>
</html>
第三步:
SpringBoot后台编写
实体类
import lombok.AllArgsConstructor;
import lombok.Data;


@Data
@AllArgsConstructor
public class FlowBean
    /**
     * 主键id
     */
    private int id;

    /**
     * 人数
     */
    private int number;

    /**
     * 时间
     */
    private String time;

    public FlowBean()


    public FlowBean(int number, String time)
        this.number = number;
        this.time = time;
编写后台Controller
import com.lovo.service.IFlowService;
import org.springframework.beans.factory.annotation.Autowired;
import org.springframework.context.annotation.Description;
import org.springframework.web.bind.annotation.RequestMapping;
import org.springframework.web.bind.annotation.RequestMethod;
import org.springframework.web.bind.annotation.ResponseBody;
import org.springframework.web.bind.annotation.RestController;

import java.util.List;

@RestController
public class OnlineController
    @Autowired
    private IFlowService flowService;

    @Description("获取Echarts数据")
    @RequestMapping(value = "/EcharsShow",method = RequestMethod.POST)
    @ResponseBody
    public List<FlowBean> sexOnline()
        List<FlowBean> flowBeans = flowService.sexOnline();
        System.out.println("flowBeans = " + flowBeans);
        return flowBeans;
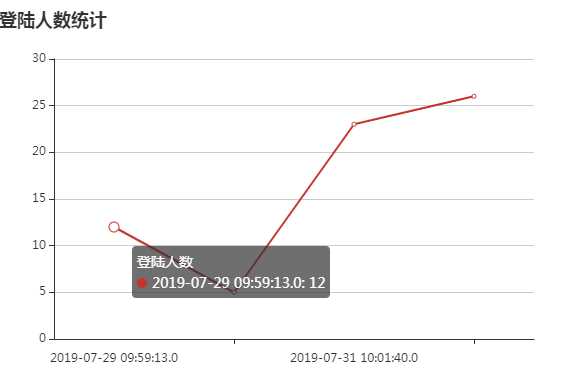
效果图

ECharts
以上是关于Srping boot + ECharts 简单应用的主要内容,如果未能解决你的问题,请参考以下文章