分类属性绘图(seaborn的catplot函数)
Posted loubin
tags:
篇首语:本文由小常识网(cha138.com)小编为大家整理,主要介绍了分类属性绘图(seaborn的catplot函数)相关的知识,希望对你有一定的参考价值。
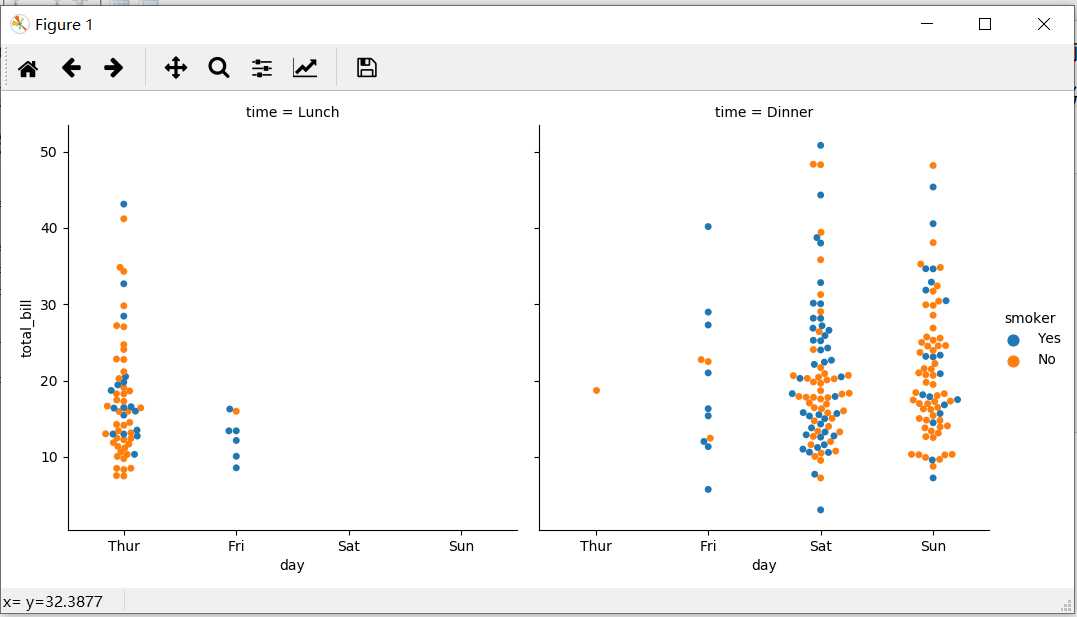
可以通过指定catplot()函数的kind参数为"bar", "box", "violin"等分别绘制以前提过的柱形图,盒图,小提琴图等。以前我们知道hue可以用不同颜色对
数据分类,catplot函数中的col参数可以在竖直方向根据某一列的分类绘制多个图形,row参数可以在水平方向根据某一列的分类绘制多个图形。
看一下代码就知道我鸡言鸡语什么了
 1 import seaborn as sns
 2 import numpy as np
 3 import pandas as pd
 4 import matplotlib as mpl
 5 import matplotlib.pyplot as plt
 6
 7 tips = sns.load_dataset("tips")   #seaborn内置数据集,DaraFram类型
 8 print(tips.head())
 9 sns.catplot(x="day", y="total_bill", hue="smoker", data=tips, kind="swarm", col="time")
10 plt.show()
运行结果如下
以上是关于分类属性绘图(seaborn的catplot函数)的主要内容,如果未能解决你的问题,请参考以下文章