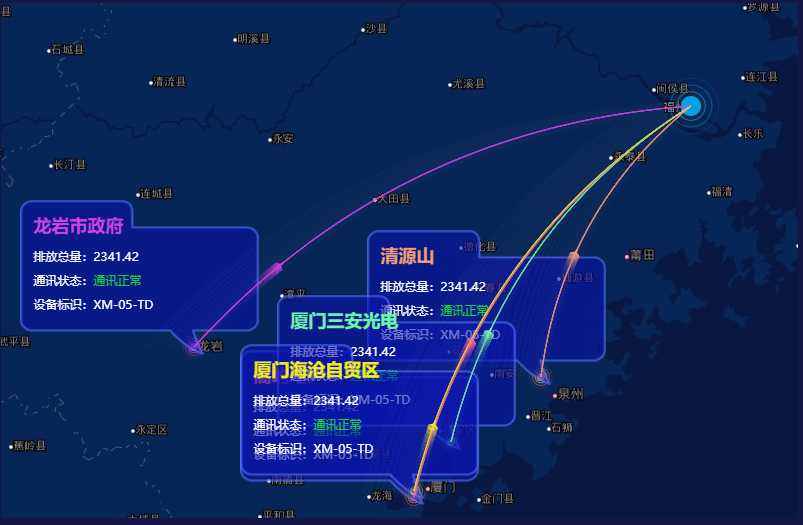
echarts+百度地图
Posted dzw159
tags:
篇首语:本文由小常识网(cha138.com)小编为大家整理,主要介绍了echarts+百度地图相关的知识,希望对你有一定的参考价值。
<html> <head> <meta name=‘viewport‘ content=‘initial-scale=1.0,user-scalable=no‘ /> <meta http-equiv=‘Content-Type‘ content=‘text/html;charset=utf-8‘ /> <title>地图Test</title> <style type="text/css"> html height:100%; body height:100%;margin:0;padding:0; .BMap_cpyCtrl display: none; .anchorBL display: none; #mainheight:600px;width:1080px; </style> <script src="./jquery.js"></script> <script src="./echarts.min.js"></script> <script type="text/javascript" src="http://api.map.baidu.com/api?v=2.0&ak=你申请的百度key"></script> <script src="./bmap.min.js"></script> </head> <body> <div id=‘bMap‘></div> <script type=‘text/javascript‘> //初始化数据 //配置样式 var styleJson=[ ‘featureType‘: ‘water‘, ‘elementType‘: ‘all‘, ‘stylers‘: ‘color‘: ‘#081843‘ , ‘featureType‘: ‘land‘, ‘elementType‘: ‘geometry‘, ‘stylers‘: ‘color‘: ‘#082657‘ , ‘featureType‘: ‘highway‘, ‘elementType‘: ‘all‘, ‘stylers‘: ‘visibility‘: ‘off‘ , ‘featureType‘: ‘arterial‘, ‘elementType‘: ‘geometry.fill‘, ‘stylers‘: ‘color‘: ‘#103963‘ , ‘featureType‘: ‘arterial‘, ‘elementType‘: ‘geometry.stroke‘, ‘stylers‘: ‘color‘: ‘#103963‘, ‘lightness‘: -70 , ‘featureType‘: ‘local‘, ‘elementType‘: ‘geometry‘, ‘stylers‘: "visibility": "off" , "featureType": "railway", "elementType": "all", "stylers": "visibility": "off" , ‘featureType‘: ‘subway‘, ‘elementType‘: ‘all‘, ‘stylers‘: "visibility": "off" , ‘featureType‘: ‘building‘, ‘elementType‘: ‘geometry.fill‘, ‘stylers‘: ‘color‘: ‘#000000‘ , ‘featureType‘: ‘all‘, ‘elementType‘: ‘labels.text.fill‘, ‘stylers‘: ‘color‘: ‘#857f7f‘ , ‘featureType‘: ‘all‘, ‘elementType‘: ‘labels.text.stroke‘, ‘stylers‘: ‘color‘: ‘#000000‘ , ‘featureType‘: ‘building‘, ‘elementType‘: ‘geometry‘, ‘stylers‘: ‘color‘: ‘#022338‘ , ‘featureType‘: ‘green‘, ‘elementType‘: ‘geometry‘, ‘stylers‘: "visibility": "off" , ‘featureType‘: ‘boundary‘, ‘elementType‘: ‘all‘, ‘stylers‘: ‘color‘: ‘#465b6c‘ , ‘featureType‘: ‘manmade‘, ‘elementType‘: ‘all‘, ‘stylers‘: ‘color‘: ‘#022338‘ , ‘featureType‘: ‘label‘, ‘elementType‘: ‘all‘, ‘stylers‘: ‘visibility‘: ‘on‘, ‘color‘: ‘#FFF‘ , "featureType": "poilabel", "elementType": "all", "stylers": "visibility": "off" , "featureType": "district", "elementType": "labels.text.stroke", "stylers": "visibility": "on" ]; //线条颜色 var colors = ["#00A0E9", "#F29B76", "#F76B8F", "#6DF3AC", "#CF42E8", "#F1EA24"]; $(function () //初始化地图 var bampCharts = echarts.init(document.querySelector("#bMap")); options = backgroupColor:"#091E43", title : show:false, text: ‘‘, subtext:‘‘, x:‘center‘, textStyle : color: ‘#fff‘ , tooltip: trigger: ‘item‘ , toolbox: show: false, right: ‘3%‘, feature: dataView: readOnly: false, restore: , saveAsImage: , bmap: //定义中心点 center: [119.308069,26.087438], zoom: 8,//地图缩放比例 roam: true,//开启用户缩放 //样式 mapStyle: styleJson: styleJson , series:[ type:‘map‘, mapType:‘china‘, coordinateSystem:‘bmap‘, data:[ name: ‘福建省‘, value: 20057.34, label: normal: show: false, formatter: function (params) return params.name + "\\n" + params.value; //地图上展示文字 + 数值 , , itemStyle: normal: areaColor: ‘#C1FFC1‘ //地图颜色 ] ] ; //实例化地图 bampCharts.setOption(options); //地图点线传输动画效果 //坐标点集合 var d = [name:‘清源山‘,longitude:118.618628,latitude:24.957289,isShow:true, name:‘嵩屿电厂‘,longitude:118.034528,latitude:24.45114,isShow:true, name:‘厦门三安光电‘,longitude:118.203815,latitude:24.683459,isShow:true, name:‘龙岩市政府‘,longitude:117.023867,latitude:25.082091,isShow:true, name:‘厦门海沧自贸区‘,longitude:118.032496,latitude:24.476532,isShow:true]; var planePath = ‘path://M1705.06,1318.313v-89.254l-319.9-221.799l0.073-208.063c0.521-84.662-26.629-121.796-63.961-121.491c-37.332-0.305-64.482,36.829-63.961,121.491l0.073,208.063l-319.9,221.799v89.254l330.343-157.288l12.238,241.308l-134.449,92.931l0.531,42.034l175.125-42.917l175.125,42.917l0.531-42.034l-134.449-92.931l12.238-241.308L1705.06,1318.313z‘; var end = name: ‘‘, position: [119.308069,26.087438] ,isShow:false; var ods = []; var marks = []; marks.push( name: end.name, isShow: end.isShow, value: end.position.concat([100]) ); d.forEach(function(el) if (!el) return; //描线 ods.push( fromName: el.name, toname: end.name, coords: [[el.longitude, el.latitude], end.position] ); //定义坐标点 marks.push( name: el.name, isShow: el.isShow, value: [el.longitude, el.latitude, 40] ); ); options.series = [ type: ‘lines‘, coordinateSystem: ‘bmap‘, zlevel: 2, data: ods, //线上面的动态特效 effect: show: true, period: 6, trailLength: 0.1, symbolSize: 10, symbol: planePath , lineStyle: normal: color: function(params) return colors[params.dataIndex + 1]; , curveness: 0.2 , type: ‘effectScatter‘, coordinateSystem: ‘bmap‘, data: marks, symbolSize: function(val) return val[2] / 5; , showEffectOn: ‘render‘, rippleEffect: period: 2, brushType: ‘stroke‘, scale: 3 , hoverAnimation: true, label: normal: formatter: function (params) if (params.data.isShow) var info = ‘\\n strong1|‘ + params.name + ‘‘ + ‘\\n\\n 排放总量:2341.42‘ + ‘\\n\\n 通讯状态:‘ + ‘color3|‘ + ‘通讯正常‘ + ‘‘ + ‘\\n\\n 设备标识:XM-05-TD‘; //地图上展示文字 + 数值 return info; else return ‘‘; , position: [-170,-145], show: true, textStyle: color: ‘#fff‘, size:‘35‘ , backgroundColor: //内容背景图 image: ‘/images/preview/popup.png‘ , //自定义控件(由于label无法解析html) rich: //设置控件引用名 strong1: fontSize: 18, fontWeight: ‘bold‘, lineHeight:25 , color1: color:‘#fff701‘//黄色 , color2: color:‘#fe0002‘//红色 , color3: color:‘#18cc47‘//绿色 , height: 150, width: 220, lineHeight: 12, padding: [5, 10] , itemStyle: normal: color: function(params) return colors[params.dataIndex]; , shadowBlur: 10, shadowColor: ‘#333‘ , zlevel: 1 ]; //实例化 bampCharts.setOption(options); ) </script>

里头碰到几个问题:
1.在纯html里头运行无法出现地图
原因:跨域问题(我是放到VS上面运行才出现地图效果的--有经过IIS)
2.echarts.min.js版本问题
3.自定义控件(由于label无法解析html--代码里头已给注释)
以上是关于echarts+百度地图的主要内容,如果未能解决你的问题,请参考以下文章