matplotlib学习---折线图(plot)
Posted huiyichanmian
tags:
篇首语:本文由小常识网(cha138.com)小编为大家整理,主要介绍了matplotlib学习---折线图(plot)相关的知识,希望对你有一定的参考价值。
一: 什么是matplotlib?
matplotlib:最流行的Python底层绘图库,主要做数据可视化图标,名字取材于MATLAB,模仿MATLAB构建。
二:matplotlib基本要点:
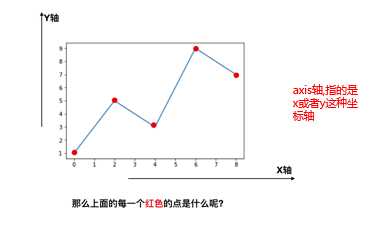
每个红色的点是坐标,把5个点的坐标连接成一条线,就组成了折线图
通过下面的小例子来看一下matplotlib该如何简单使用
假设一天中每隔两个小时(range(2,26,2))的气温(℃)分别是[15,13,14.5,17,20,25,26,26,27,22,18,15]
from matplotlib import pyplot as plt

# 数据在x轴的位置,是一个可迭代对象
x = range(2, 26, 2)

# 数据在y轴的位置,是一个可迭代对象
y = [15, 13, 14, 5, 17, 20, 25, 26, 24, 22, 18, 12]

#x轴和y轴的数据一起组成了所有药绘制出的坐标¶
#传入x和y,通过plot绘制出折线图
plt.plot(x,y)
plt.show()  # 在pycharm中展示图形,Juptyer notebook不用
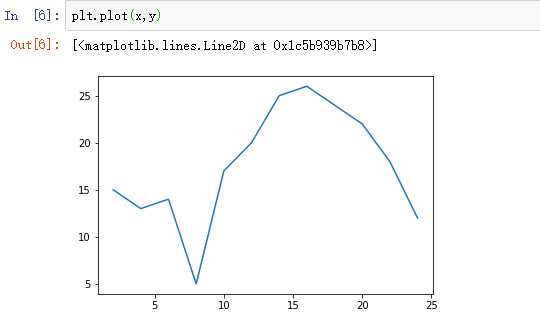
目前就简单的绘制出一个折线图,但是目前存在以下几个问题:
1.设置图片的大小(想要一个高清无码大图)
plt.figure(figsize=(20,8),dpi=80)
——→ figure图形图标的意思,这里指明我们要画的图
——→通过实例化一个figure并且传递参数,能够在后台自动使用该figure实例
——→在图像模糊的时候,可以传入dpi参数,让图片更加清晰
2.保存到本地
plt.savefig("./sig_size.png")
3.描述信息,比如x轴和y轴表示什么,这个图表示什么?
plt.xlabel("时间")  # 这样添加中文会显示乱码,需要设置fontproperties
plt.ylabel("温度 单位(℃)")
plt.title("10点到12点每分钟气温变化")
4.调整x或y的刻度间距
plt.xticks(x)  # 设置x刻度
# plt.xticks(x[::2]) # 当刻度太密集的时候,使用列表的步长(间隔取值)来解决,
那么问题来了:
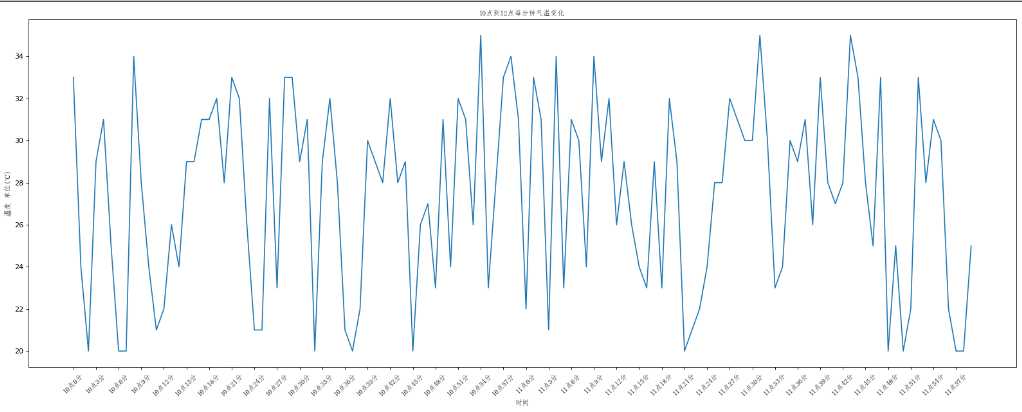
如果列表a表示10点到12点的每一分钟的气温,如何绘制折线图观察每分钟气温变化情况?
a = [random.randint(20,35) for i in range(120)]
xtick_labels = ["10点分".format(i) for i in range(60)] # 设置x轴上的刻度
xtick_labels += ["11点分".format(i) for i in range(60)]
plt.xticks(_x, xtick_labels[::3], rotation=90) # 中文显示不出来,需要设置fontproperties,rotation=90表示旋转90°
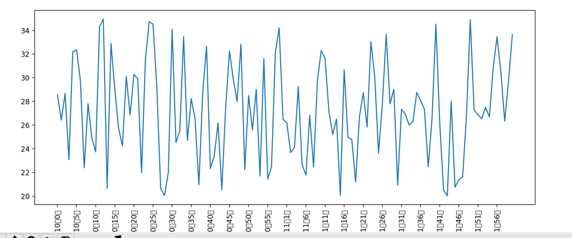
matplotlib默认不支持中文字符,通过font_manager解决
from matplotlib import font_manager

my_font = font_manager.FontProperties(fname=r"C:\\Windows\\Fonts\\simfang.ttf")
plt.xlabel("时间", fontproperties=my_font)
plt.ylabel("温度 单位(℃)", fontproperties=my_font)
plt.title("10点到12点每分钟气温变化", fontproperties=my_font)
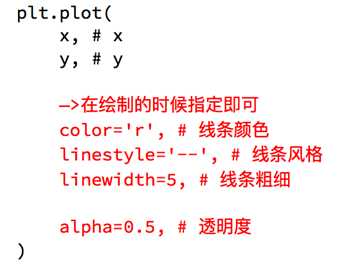
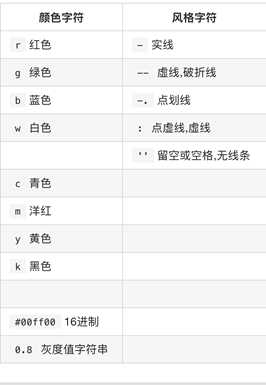
5.线条的样式(比如颜色,透明度等)
完整代码:
import random
from matplotlib import font_manager
from matplotlib import pyplot as plt

my_font = font_manager.FontProperties(fname=r"C:\\Windows\\Fonts\\simfang.ttf")

x = range(0, 120)
y = [random.randint(20, 35) for i in range(120)]
plt.figure(figsize=(20, 8), dpi=80)
plt.plot(x, y)

# 调整x的刻度
_x = list(x)[::3]
print(_x)
xtick_labels = ["10点分".format(i) for i in range(60)]
xtick_labels += ["11点分".format(i) for i in range(60)]
print(xtick_labels)
plt.xticks(_x, xtick_labels[::3], rotation=45, fontproperties=my_font)

# 添加描述信息
plt.xlabel("时间", fontproperties=my_font)
plt.ylabel("温度 单位(℃)", fontproperties=my_font)
plt.title("10点到12点每分钟气温变化", fontproperties=my_font)

plt.show()
动手1:
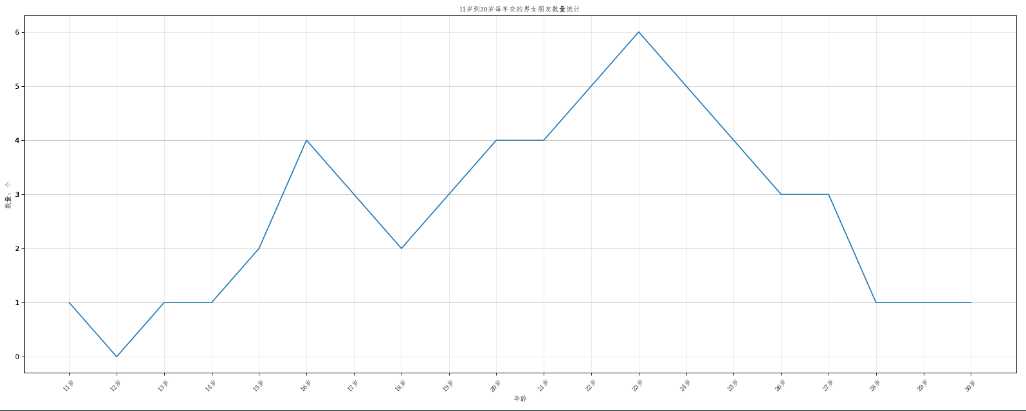
假设大家在30岁的时候,根据自己的实际情况,统计出来了从11岁到30岁每年交的女(男)朋友数量如列表啊,请绘制出该数据的折线图,以便分析自己每年交女(男)朋友的数量走势
a = [1,0,1,1,2,4,3,2,3,4,4,5,6,5,4,3,3,1,1,1]
要求:y轴表示个数
x轴表示岁数,如11岁,12岁
from matplotlib import pyplot as plt, font_manager

a = [1,0,1,1,2,4,3,2,3,4,4,5,6,5,4,3,3,1,1,1]
x = range(11, 31)

my_font = font_manager.FontProperties(fname=r"C:\\Windows\\Fonts\\simfang.ttf")

plt.figure(figsize=(20, 8), dpi=80)
plt.plot(x, a)

plt.xticks(x, ["岁".format(i) for i in x], rotation=45, fontproperties=my_font)
plt.yticks(a)

plt.ylabel("数量:个", fontproperties=my_font)
plt.xlabel(‘年龄‘, fontproperties=my_font)
plt.title("11岁到30岁每年交的男女朋友数量统计", fontproperties=my_font)

# 绘制网格
plt.grid(alpha=0.3)

plt.show()
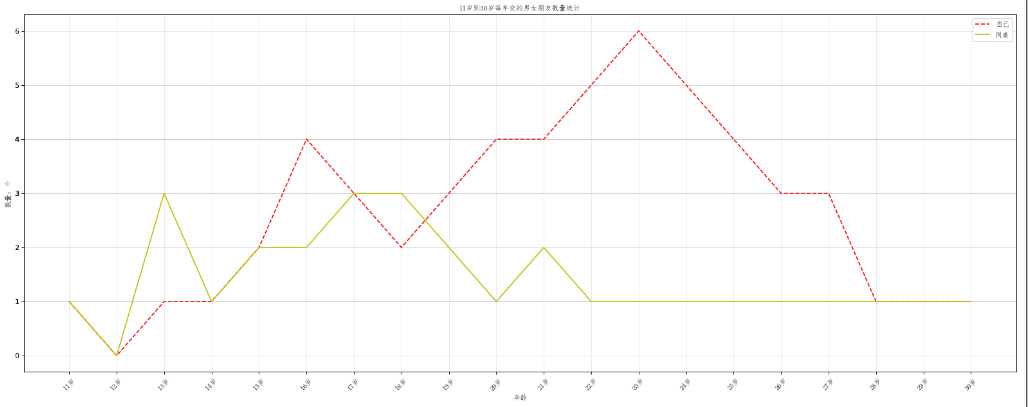
动手2:假设大家在30岁时候,根据自己的实际情况,统计出你和你同坐各自从11岁到30岁每年交的女(男)朋友的数量如列表a和b,请在一个图中绘制出该数据的折线图,以便比较自己和同坐20年间的差异,同时分析每年交女男(朋友的走势)
a = [1,0,1,1,2,4,3,2,3,4,4,5,6,5,4,3,3,1,1,1]
b = [1,0,3,1,2,2,3,3,2,1,2,1,1,1,1,1,1,1,1,1]
要求:y轴表示个数
   x轴表示岁数,比如11岁,12岁
from matplotlib import pyplot as plt, font_manager

a = [1,0,1,1,2,4,3,2,3,4,4,5,6,5,4,3,3,1,1,1]
b = [1,0,3,1,2,2,3,3,2,1,2,1,1,1,1,1,1,1,1,1]
x = range(11, 31)

my_font = font_manager.FontProperties(fname=r"C:\\Windows\\Fonts\\simfang.ttf")

plt.figure(figsize=(20, 8), dpi=80)
plt.plot(x, a, label="自己", color="r", linestyle="--")
plt.plot(x, b, label="同桌", color="y")

plt.xticks(x, ["岁".format(i) for i in x], rotation=45, fontproperties=my_font)
plt.yticks(a)

plt.ylabel("数量:个", fontproperties=my_font)
plt.xlabel(‘年龄‘, fontproperties=my_font)
plt.title("11岁到30岁每年交的男女朋友数量统计", fontproperties=my_font)

# 绘制网格
plt.grid(alpha=0.3)

# 添加图例
plt.legend(prop=my_font)  # 只有在legend中用prop添加显示中文

plt.show()
以上是关于matplotlib学习---折线图(plot)的主要内容,如果未能解决你的问题,请参考以下文章