Matplotlib学习
Posted yqpy
tags:
篇首语:本文由小常识网(cha138.com)小编为大家整理,主要介绍了Matplotlib学习相关的知识,希望对你有一定的参考价值。
前言
在B站上把莫烦的Matplotlib教学视频刷一遍
正文
一、
首先是Matplotlib的基本用法
import matplotlib.pyplot as plt
import numpy as np
#%matplotlib auto
#%matplotlib qt5
x = np.linspace(-1,1,50)
y = 2*x+1

plt.plot(x,y)
plt.show()
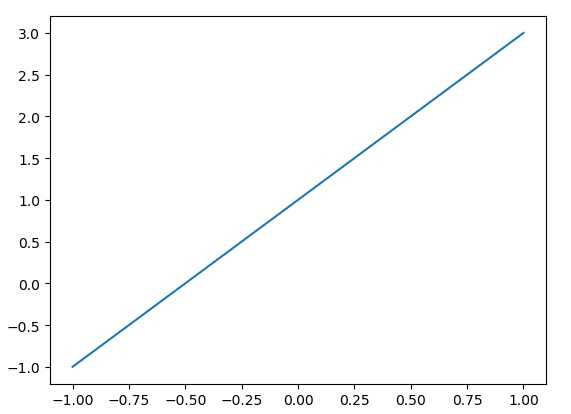
首先上述代码如果是在jupyter notebook中执行的,那么注释掉的两行就要至少放一行在这里,才会出现独立的图片,否则会是内嵌在jupyter notebook里;
当然,如果是单独运行一个py文件,那么上述这两行就不能写上去,否则要报错;
二、
接着是figure的使用方法,figure是设定指定窗口来画图,多个figure有多个图片,也可以在一个figure里画好几条线
%matplotlib qt5
x = np.linspace(-3,3,50)
y1 = 2*x+1
y2 = x**2

plt.figure()
plt.plot(x,y1)

plt.figure(num=3,figsize=(8,5))
plt.plot(x,y2)
#plt.plot(x,y1,color=‘red‘,linewidth=1.0,linestyle=‘--‘)

plt.show()
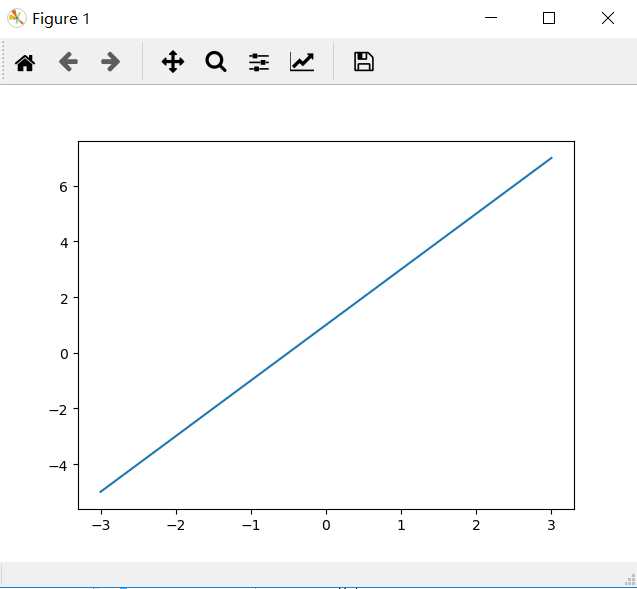
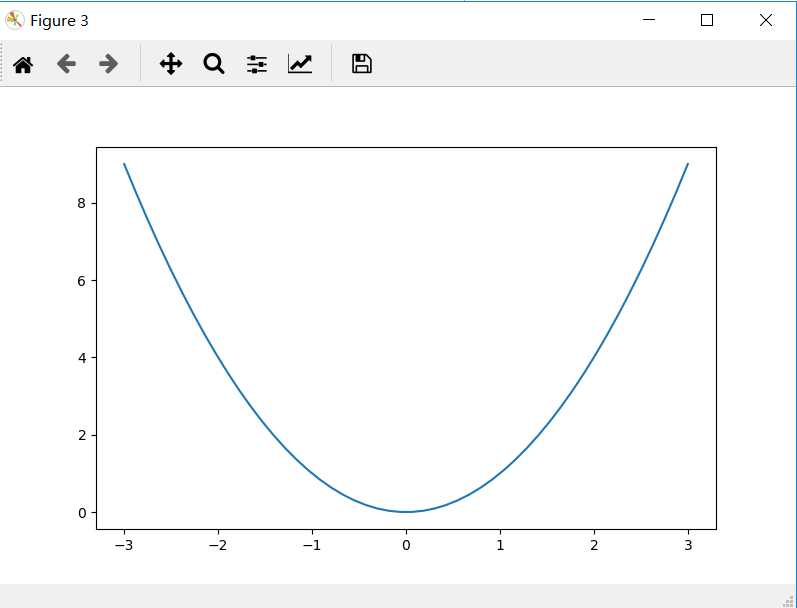
表示两个figure生成两个图片,其中第二个图片设定为序号3,并且长和宽也指定
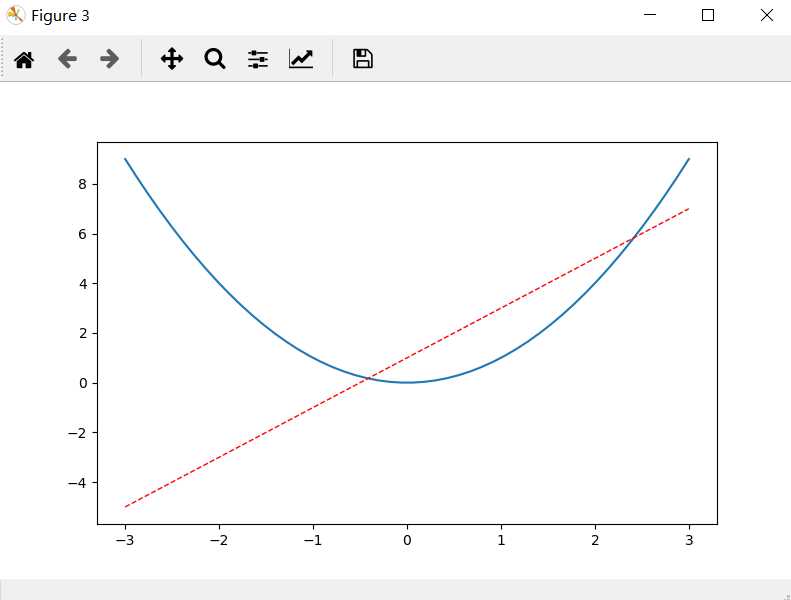
同样,当我需要在一个图片里放两条线时,只需
%matplotlib qt5
x = np.linspace(-3,3,50)
y1 = 2*x+1
y2 = x**2

plt.figure()
plt.plot(x,y1)

plt.figure(num=3,figsize=(8,5))
plt.plot(x,y2)
plt.plot(x,y1,color=‘red‘,linewidth=1.0,linestyle=‘--‘)

plt.show()
三、
坐标轴修改
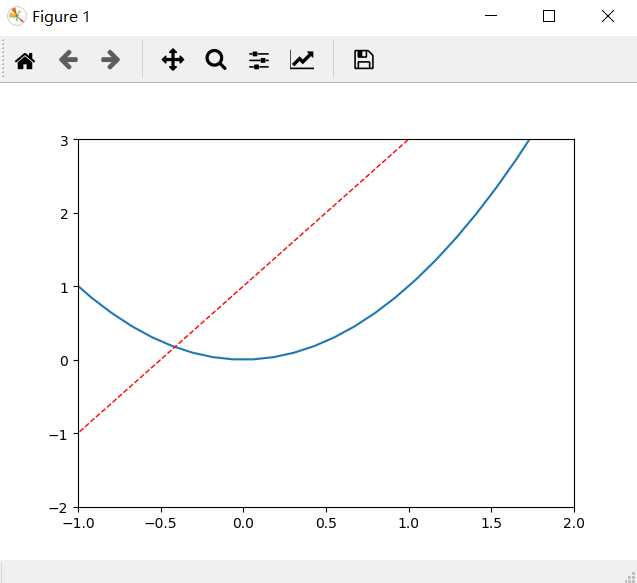
首先我们看一下怎样限定x和y轴的坐标范围:
%matplotlib qt5
x = np.linspace(-3,3,50)
y1 = 2*x+1
y2 = x**2

plt.figure()
plt.plot(x,y2)
plt.plot(x,y1,color=‘red‘,linewidth=1.0,linestyle=‘--‘)

plt.xlim((-1,2))
plt.ylim((-2,3))


plt.show()
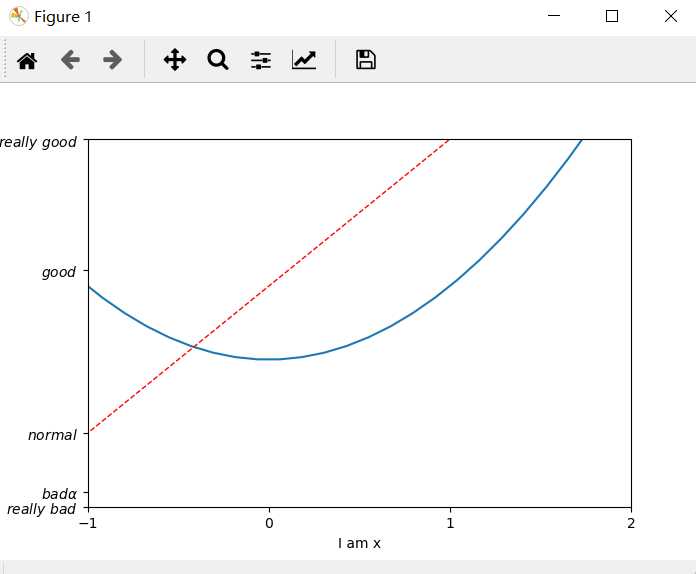
接着看看对坐标轴说明进行修改
%matplotlib qt5
x = np.linspace(-3,3,50)
y1 = 2*x+1
y2 = x**2

plt.figure()
plt.plot(x,y2)
plt.plot(x,y1,color=‘red‘,linewidth=1.0,linestyle=‘--‘)

plt.xlim((-1,2))
plt.ylim((-2,3))
plt.xlabel(‘I am x‘)
plt.ylabel(‘I am y‘)

new_ticks= np.linspace(-1,2,4)
print(new_ticks)
plt.xticks(new_ticks)
plt.yticks([-2,-1.8,-1,1.22,3,],
           [r‘$really\\ bad$‘,r‘$bad \\alpha$‘,r‘$normal$‘,r‘$good$‘ ,r‘$really\\ good$‘])
plt.show()
xticks和yticks有两个返回值,一个是刻度,一个刻度标签
以上是关于Matplotlib学习的主要内容,如果未能解决你的问题,请参考以下文章