Notes on Linux Blktrace
Posted
tags:
篇首语:本文由小常识网(cha138.com)小编为大家整理,主要介绍了Notes on Linux Blktrace相关的知识,希望对你有一定的参考价值。
0 Usage
blktrace: Device configuration, and event extraction utility.
-Store events in long term storge
-Or, pipe to blkparse utility for live tracing
blkparse: Event formatting utility
-Supports textual or binary dump output
$blktrace -d <device> [ -r debug_path ] [ -o output ] [ -k ] [ -w time ]
$blkparse -i <input> []
As noted previously, blktrace does not analyze the data, it is responsible for storing and formatting events.
------------------------------------------------------------------------------------------------------------------------------------------
1.1 blktrace User Guide
The blktrace utility extracts event traces from the kernel (via the relaying through the debug file system).
- blktrace receives data from the kernel in buffers passed up through the debug file system (relay). Each device being traced has a file created in the mounted directory for the debugfs, which defaults to /sys/kernel/debug - this can be overridden with the -r command line argument.
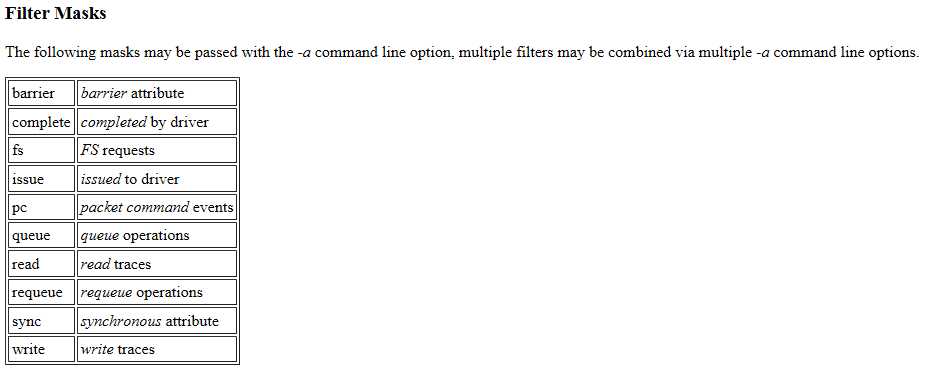
- blktrace defaults to collecting all events that can be traced. To limit the events being captured, you can specify one or more filter masks via the -a option.
Alternatively, one may specify the entire mask utilizing a hexadecimal value that is version-specific. (Requires understanding of the internal representation of the filter mask).
- As noted above, the events are passed up via a series of buffers stored into debugfs files. The size and number of buffers can be specified via the -b and -n arguments respectively.
- blktrace stores the extracted data into files stored in the local directory. The format of the file names is (by default) device.blktrace.cpu, where device is the base device name (e.g, if we are tracing /dev/sda, the base device name would be sda); and cpu identifies a CPU for the event stream.
The device portion of the event file name can be changed via the -o option.
- blktrace may also be run concurrently同时 with blkparse to produce live output - to do this specify -o - for blktrace.
- The default behaviour for blktrace is to run forever until explicitly killed by the user (via a control-C, or kill utility invocation调用). There are two ways to modify this:
- You may utilize the blktrace utility itself to kill a running trace - via the -k option.
- You can specify a run-time duration for blktrace via the -w option - then blktrace will run for the specified number of seconds, and then halt.
1.2 Command Line arguments
-d Use specified devices
-r Path to mounted debugfs, defaults to /sys/kernel/debug
-o File(s) to send output to
-k Kill running trace
-w Stop after defined time, in seconds.
-b Sub buffer size in kiB
-n Number of sub buffers
-a Add mask to current filter. Available actions are:READ, WRITE, BARRIER, SYNC, QUEUE, REQUEUE, ISSUE, COMPLETE, FS, PC.
-A Set filter mask to hex-mask
------------------------------------------------------------------------------------------------------------------------------------------
2.1 blkparse User Guide
The blkparse utility will attempt to combine streams of events for various devices on various CPUs, and produce a formatted output of the event information. As with blktrace, some details concerning blkparse will help in understanding the command line options presented below.
- By default, blkparse expects to run in a post-processing mode - one where the trace events have been saved by a previous run of blktrace, and blkparse is combining event streams and dumping formatted data.
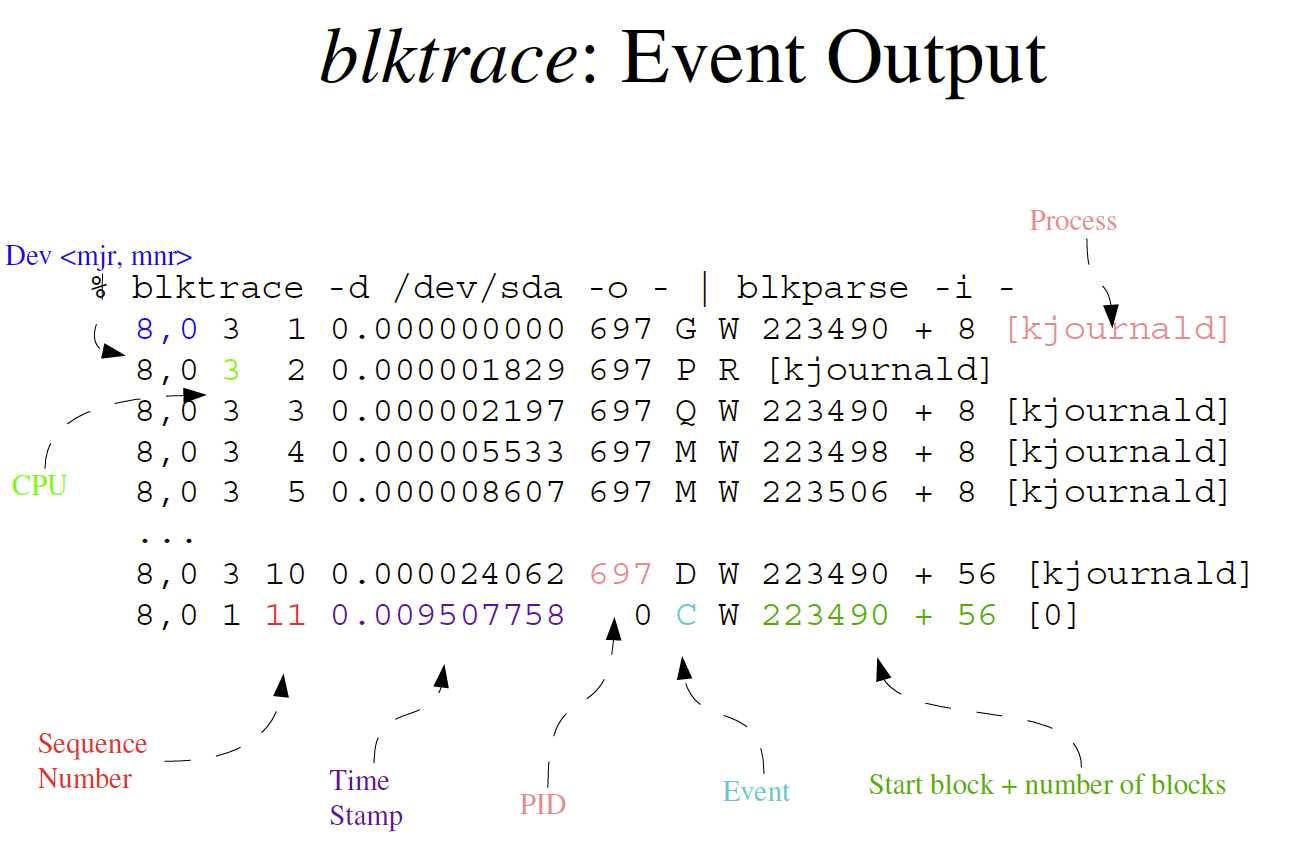
blkparse may be run in a live manner concurrently with blktrace by specifying -i - to blkparse, and combining it with the live option for blktrace. An example would be:
% blktrace -d /dev/sda -o - | blkparse -i -
- You can set how many blkparse batches批 event reads via the -b option, the default is to handle events in batches of 512.
- If you have saved event traces in blktrace with different output names (via the -o option to blktrace), you must specify the same input name via the -i option.
- The format of the output data can be controlled via the -f or -F options.
By default, blkparse sends formatted data to standard output. This may be changed via the -o option, or text output can be disabled via the -O option. A merged binary stream can be produced using the -d option.
2.2 Command Line arguments
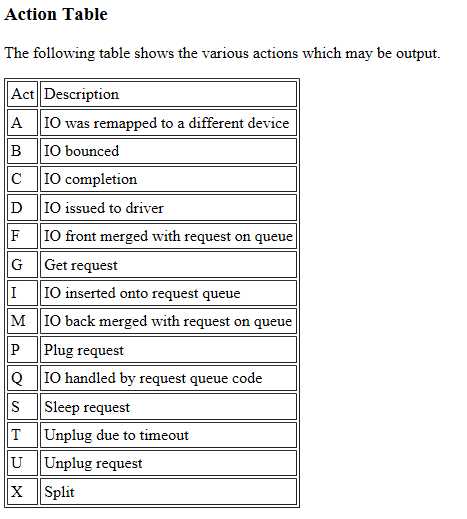
2.3 Trace actions(Events)
2.4 Output Description and Formatting
------------------------------------------------------------------------------------------------------------------------------------------
Appendix
以上是关于Notes on Linux Blktrace的主要内容,如果未能解决你的问题,请参考以下文章