第一个微信小项目
Posted howtobecool
tags:
篇首语:本文由小常识网(cha138.com)小编为大家整理,主要介绍了第一个微信小项目相关的知识,希望对你有一定的参考价值。
本文主要介绍利用网页端微信获取数据,实现个人微信好友数据的获取,并 进行一些简单的数据分析,功能包括:
1.爬取好友列表,显示好友昵称、性别和地域和签名, 文件保存为 xlsx 格式
2.统计好友的地域分布,并且做成词云和可视化展示在地图上
a.首先,获取用户信息
#导入模块
from wxpy import *

#初始化机器人,选择缓存模式(扫码)登录
bot = Bot(cache_path=True)

#获取我的所有微信好友信息
friend_all = bot.friends()
b.统计用户信息
len(friend_all)
c.数据分析
Friends = bot.friends()
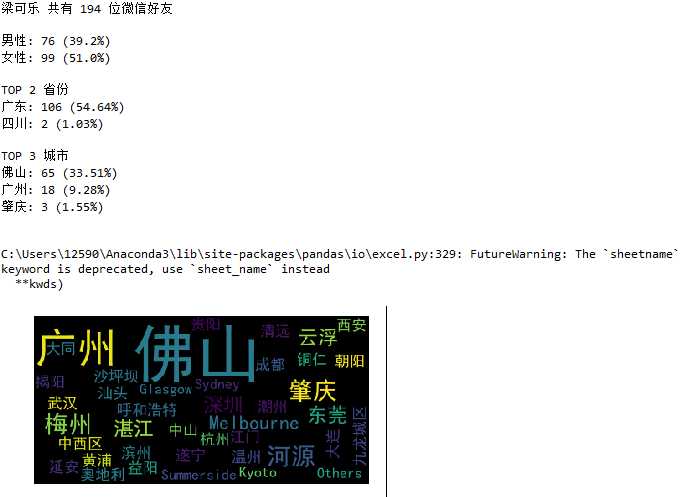
data = Friends.stats_text(total=True, sex=True,top_provinces=2, top_cities=3)
print(data)
再从本地的excel中读取数据进行分析,并查看数据类型;
from pandas import read_excel
df = read_excel(‘wx.xlsx‘,sheetname=‘list2excel07‘)
df.tail(5)
最后对city列数据做成词云;
(这里我利用plt+wordcloud方法)
from wordcloud import WordCloud
import matplotlib.pyplot as plt
import pandas as pd
from pandas import DataFrame
word_list= df[‘City‘].fillna(‘0‘).tolist()
new_text = ‘ ‘.join(word_list)
wordcloud = WordCloud(font_path=‘simhei.ttf‘,  background_color="black").generate(new_text)
plt.imshow(wordcloud)
plt.axis("off")
plt.show()
完整代码如下:
#导入模块
from wxpy import *

#初始化机器人,选择缓存模式(扫码)登录
bot = Bot(cache_path=True)

#获取我的所有微信好友信息
friend_all = bot.friends()
print(friend_all[0].raw)
len(friend_all)
lis=[]
for a_friend in friend_all:
    NickName = a_friend.raw.get(‘NickName‘,None)
    #Sex = a_friend.raw.get(‘Sex‘,None)
    Sex =1:"男",2:"女",0:"其它".get(a_friend.raw.get(‘Sex‘,None),None)
    City = a_friend.raw.get(‘City‘,None)
    Province = a_friend.raw.get(‘Province‘,None)
    Signature = a_friend.raw.get(‘Signature‘,None)
    HeadImgUrl = a_friend.raw.get(‘HeadImgUrl‘,None)
    HeadImgFlag  = a_friend.raw.get(‘HeadImgFlag‘,None)
    list_0=[NickName,Sex,City,Province,Signature,HeadImgUrl,HeadImgFlag]
    lis.append(list_0)
def lis2e07(filename,lis):
    import openpyxl
    wb = openpyxl.Workbook()
    sheet = wb.active
    sheet.title = ‘list2excel07‘
    file_name = filename +‘.xlsx‘
    for i in range(0, len(lis)):
         for j in range(0, len(lis[i])):
             sheet.cell(row=i+1, column=j+1, value=str(lis[i][j]))
    wb.save(file_name)
    print("写入数据成功!")
#lis2e07(‘wx‘,lis)
Friends = bot.friends()
data = Friends.stats_text(total=True, sex=True,top_provinces=2, top_cities=3)
print(data)
from pandas import read_excel
df = read_excel(‘wx.xlsx‘,sheetname=‘list2excel07‘)
df.tail(5)
df[‘City‘].count()
df[‘City‘].describe()
from wordcloud import WordCloud
import matplotlib.pyplot as plt
import pandas as pd
from pandas import DataFrame
word_list= df[‘City‘].fillna(‘0‘).tolist()
new_text = ‘ ‘.join(word_list)
wordcloud = WordCloud(font_path=‘simhei.ttf‘,  background_color="black").generate(new_text)
plt.imshow(wordcloud)
plt.axis("off")
plt.show()
结果显示:

以上是关于第一个微信小项目的主要内容,如果未能解决你的问题,请参考以下文章