matplotlib画3D图修改X,Y,Z,colorbar的刻度值
Posted nxf-rabbit75
tags:
篇首语:本文由小常识网(cha138.com)小编为大家整理,主要介绍了matplotlib画3D图修改X,Y,Z,colorbar的刻度值相关的知识,希望对你有一定的参考价值。
修改X,Y,Z轴的刻度值
from matplotlib.ticker import MultipleLocator,FuncFormatter
from mpl_toolkits.mplot3d import Axes3D
import matplotlib.pyplot as plt
from matplotlib import cm
from matplotlib import colors
from matplotlib.ticker import LinearLocator, FormatStrFormatter
import numpy as np
import matplotlib.ticker as ticker

def fun(x):
    if x >= 1:
        return 1
    return x

def to_percent(temp, position):
    return ‘%1.0f‘%(100*temp)

x = np.arange(0, 0.5, 0.001)
y = np.arange(0, 0.05, 0.001)
x, y = np.meshgrid(x, y)
z = (3*x+y-x*x-np.sqrt(2*x*x*x-3*x*x*x*x+x*x+22*x*x*y-22*x*y-12*x*x*x*y-8*x*x*y*y+12*x*y*y-7*y*y))/(2*x+2*y)

for row in range(len(z)):
    for col in range(len(z[0])):
        z[row][col] = fun(z[row][col])

fig = plt.figure()
ax = fig.gca(projection=‘3d‘)
ax.set_zlim3d(0.6,1.0)
ax.zaxis.set_major_locator(LinearLocator(5))#Z轴显示5个刻度值

norm = colors.Normalize(vmin=0.6,vmax=1.0)
ax.xaxis.set_major_formatter(FuncFormatter(to_percent))#将X,Y,Z轴的坐标轴放大100倍
ax.yaxis.set_major_formatter(FuncFormatter(to_percent))
ax.zaxis.set_major_formatter(FuncFormatter(to_percent))

ax.set_xlabel(r‘$\\alpha$(%)‘)
ax.set_ylabel(r‘$\\theta$(%)‘)
ax.set_zlabel(r‘$\\gamma^*$(%)‘)#坐标轴

surf = ax.plot_surface(x, y, z,
                       cmap=cm.coolwarm,
                       linewidth=0,
                       norm=norm,
                       antialiased=False,
                       edgecolor=‘none‘)
ax.contourf(x,y,z,zdir=‘z‘,offset=-2,cmap=‘rainbow‘)
修改colorbar的刻度为百分的形式
def fmt(x,pos):
    print(x)
    # a, b = ‘:2.2e‘.format(x).split(‘e‘)
    # b = int(b)
    return r‘$$%‘.format(int(x*100))
cbar = plt.colorbar(surf,shrink=0.5, aspect=5,format=ticker.FuncFormatter(fmt))#format用来修改调色板的刻度值
cbar.set_ticks([.6,.7,.8,.9,1.0]) plt.tight_layout()
plt.savefig(‘实验图.svg‘,dpi=600) #指定分辨率保存
plt.show()
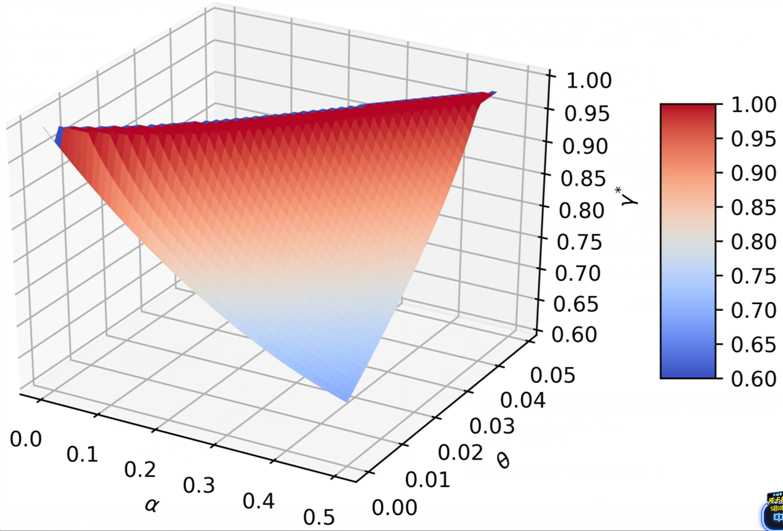
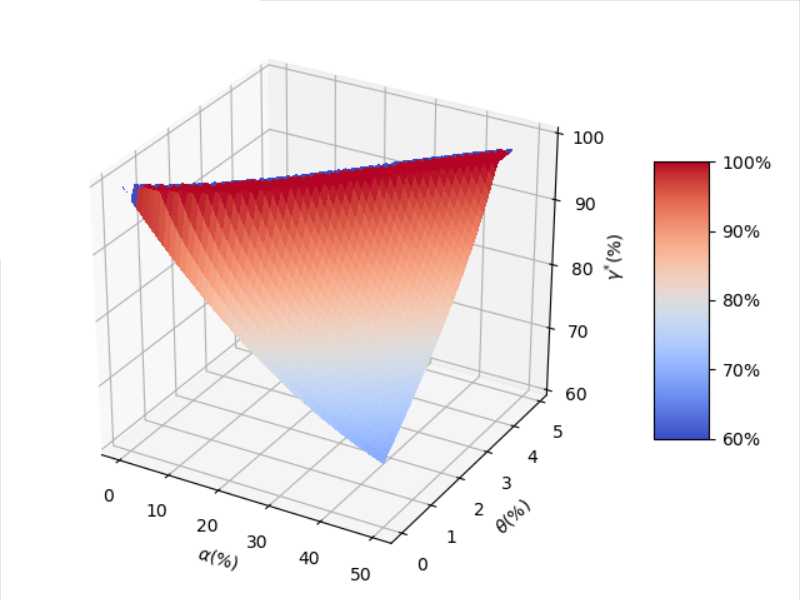
| 未修改前 | 修改后 |

|

|
|
alpha:0.0-0.5 theta:0.00-0.05 gamma:0.60-1.00 colorbar:0.60-1.00 |
alpha:0:50(每个乘以100) theta:0-5(每个乘以100) gamma:60-100(每个乘以100) colorbar:60%-100%(每个乘以100) |
参考文献:
【2】解决python画图中colorbar设置刻度和标签字体大小
【3】Matplotlib:给子图添加colorbar(颜色条或渐变色条)
以上是关于matplotlib画3D图修改X,Y,Z,colorbar的刻度值的主要内容,如果未能解决你的问题,请参考以下文章