gdb 调试多线程
Posted sssblog
tags:
篇首语:本文由小常识网(cha138.com)小编为大家整理,主要介绍了gdb 调试多线程相关的知识,希望对你有一定的参考价值。
以boost thread为例:
#include <boost/thread.hpp>
#include <iostream>

void wait(int seconds) {
  boost::this_thread::sleep(boost::posix_time::seconds(seconds));
}

void thread1() {
  while (1) {
    wait(1);
    std::cout << boost::this_thread::get_id() << std::endl;
  }
}

void thread2() {
  while (1) {
    wait(1);
    std::cout << boost::this_thread::get_id() << std::endl;
  }
}

int main() {
  boost::thread t1(thread1);
  boost::thread t2(thread2);
  t1.join();
  t2.join();
  return 1;
}
使用gdb进行编译:g++ -std=c++11 -g -Wall -I/usr/local/boost/include testThread.cpp -L/usr/local/boost/lib -lboost_system -lboost_thread -o testThread (其中boost库的头文件路径和库路径为安装boost所在路径)
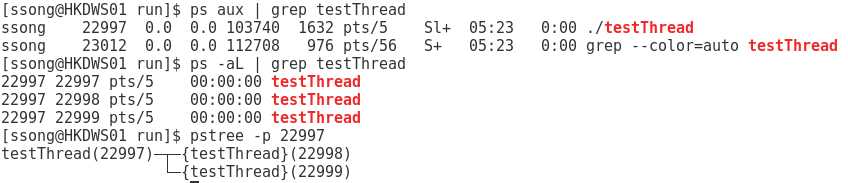
1. 首先使用ps命令查看线程及线程间关系
ps aux | grep testThread 查看当前运行的线程
ps -aL | grep testThread 查看当前运行的轻量级线程
pstree -p 主线程id 查看主线程和新线程之间的关系
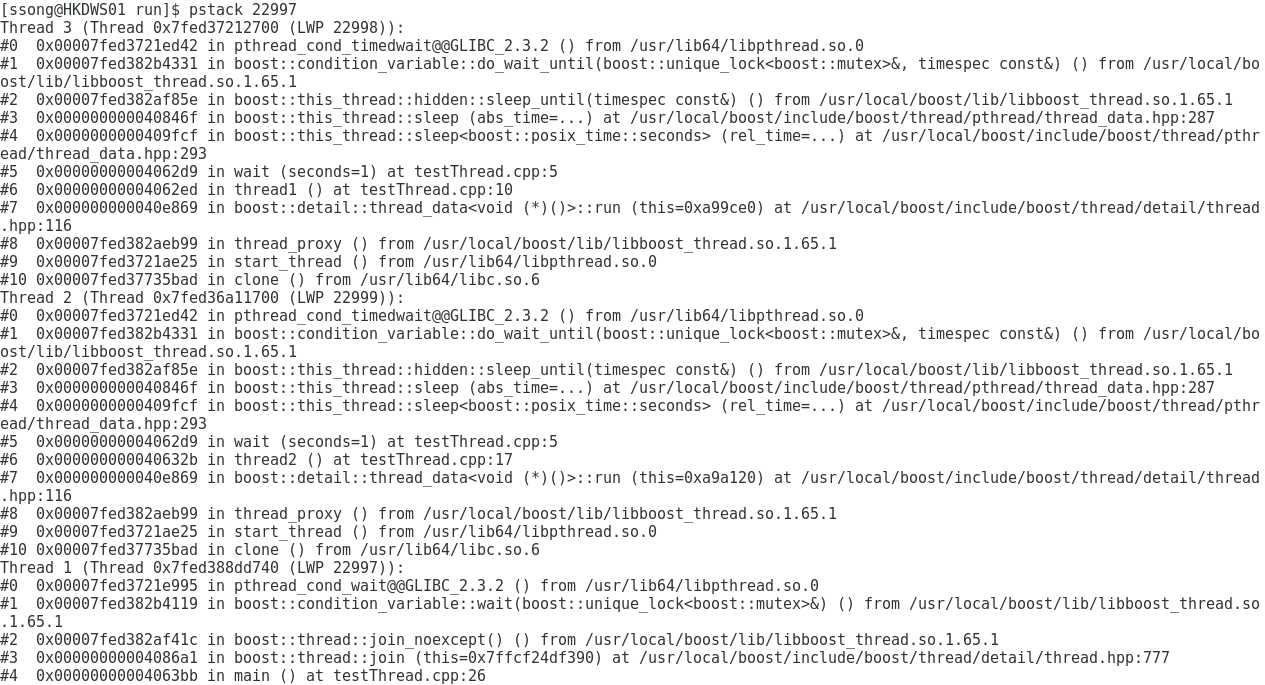
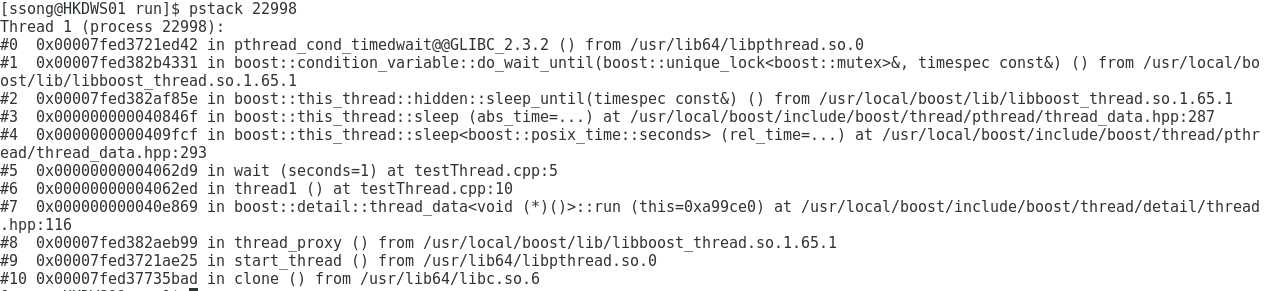
pstack 线程id 查看线程的线程栈结构
以下为上面代码的测试结果:
查看主线程堆栈:
查看新线程堆栈:
2. gdb调试多线程
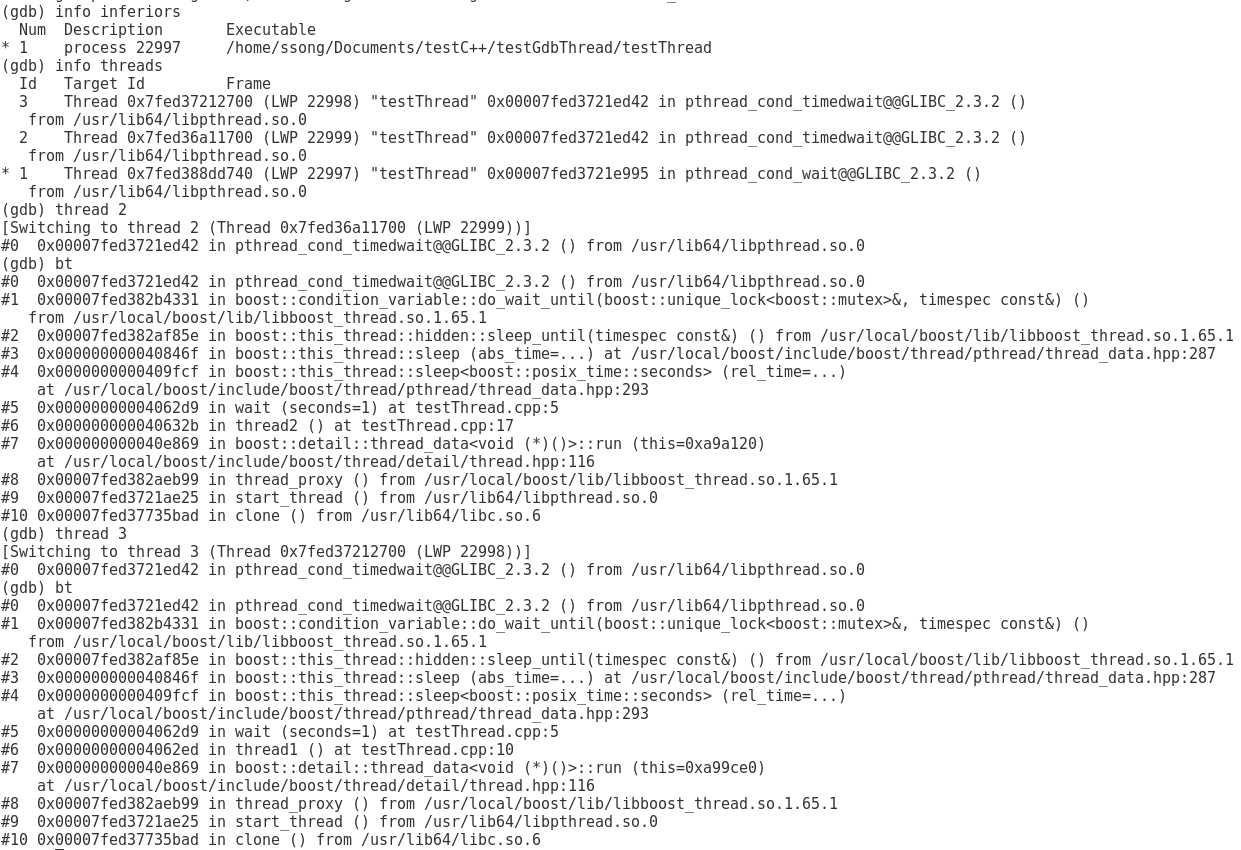
gdb attach 主线程id
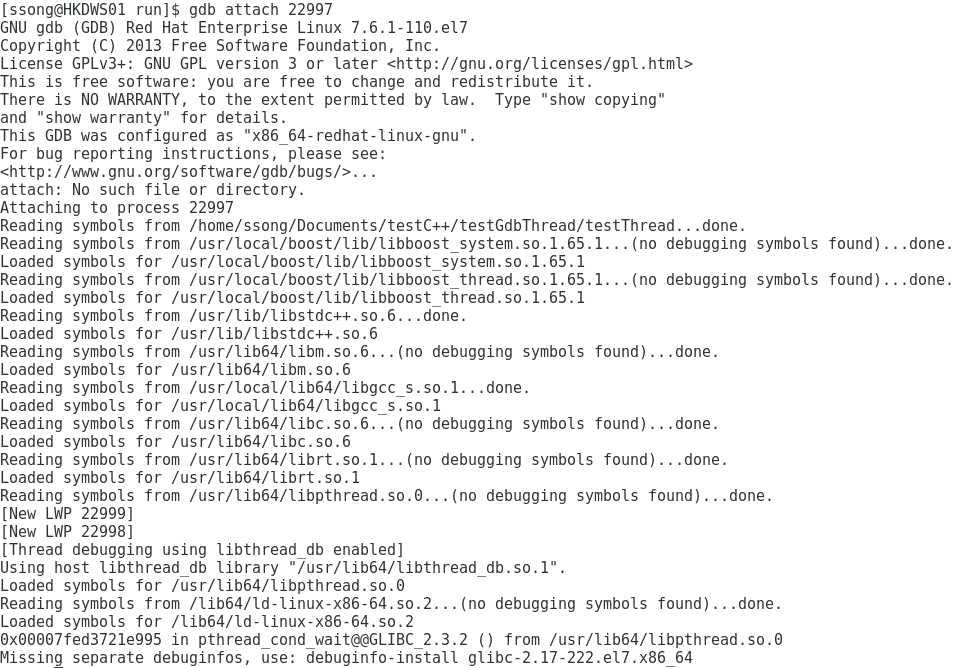
info 查看进程和线程信息,info inferiors查看进程,info threads查看所有线程,*为当前线程,thread n切换到第n个线程,bt查看线程栈结构。
只运行当前线程: set scheduler-locking on 和所有线程并发运行: set scheduler-locking off
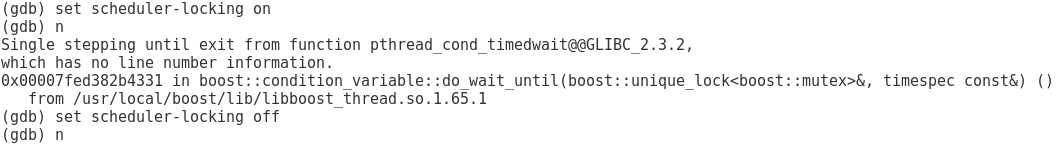
切换到某一线程时,实际调试过程和普通的调试程序一样,用break添加断点,n进行下一步。
3. 调试多线程的命令总结如下:
| 命令 | 用法 |
| info threads | 显示当前可调试的所有线程,每个线程会有一个GDB为其分配的ID,后面操作线程的时候会用到这个ID。 前面有*的是当前调试的线程 |
| thread ID(1,2,3…) | 切换当前调试的线程为指定ID的线程 |
| break thread_test.c:123 thread all(例:在相应函数的位置设置断点break pthread_run1) | 在所有线程中相应的行上设置断点 |
| thread apply ID1 ID2 command | 让一个或者多个线程执行GDB命令command |
| thread apply all command | 让所有被调试线程执行GDB命令command |
| set scheduler-locking 选项 command | 设置线程是以什么方式来执行命令 |
| set scheduler-locking off | 不锁定任何线程,也就是所有线程都执行,这是默认值 |
| set scheduler-locking on | 只有当前被调试程序会执行 |
| set scheduler-locking on step | 在单步的时候,除了next过一个函数的情况(熟悉情况的人可能知道,这其实是一个设置断点然后continue的行为)以外,只有当前线程会执行 |
以上是关于gdb 调试多线程的主要内容,如果未能解决你的问题,请参考以下文章