ero-configuration Web Application Debugging with Xdebug and PhpStorm
Posted
tags:
篇首语:本文由小常识网(cha138.com)小编为大家整理,主要介绍了ero-configuration Web Application Debugging with Xdebug and PhpStorm相关的知识,希望对你有一定的参考价值。
1. Install Xdebug
To use Xdebug with phpStorm for debugging PHP applications, you need to have a PHP development environment configured with Xdebug extension installed. This task is beyond PhpStorm’s control. More information on configuring PHP development environment can be found in our web help.
Make sure that you have Xdebug installed properly. Please note that your Xdebug version should fit the PHP version you have (mind the PHP version number and thread-safe/non-thread-safe option) and installed as zend_extension. Don’t forget to set the xdebug.remote_enable setting to 1 in php.ini file. Detailed information on installing and configuring Xdebug can be found here. You can download the latest version of the Xdebug plugin at its official website. Recommended stable versions are 2.2.1 or 2.1.3.
You can check the configuration by executing php --version in the terminal

Alternatively, execute a page with phpinfo(); PHP function and make sure that you have Xdebug extension enabled. The xdebug section of the document with the installed version should be available.

2. Prepare PhpStorm
Toggle the “Start Listening for PHP Debug Connections” button. Don’t use any run configurations.


Once you‘ve installed and configured Xdebug, you can use the Validating Your Debugging Configuration tool to confirm that the configuration of Xdebug and PhpStorm are compatible.
3. Set a breakpoint in the source code

Apart from setting the breakpoint manually, you can use the option Run | Break at first line in PHP scripts to have an automatic breakpoint at the first line of every PHP script you debug.
4. Activate debugger on server
In order to activate the debugger, you need to set a special GET/POST or COOKIE parameter (click here for details). You can do it manually, but it is much more convenient to use one a special tool such as browser toolbar or bookmarklet for that.
Try our PhpStorm bookmarklets generator and get bookmarklets which will work in any modern browser and allow you to start/stop a debugging session by controlling the Xdebug cookie.
5. Start a debug session in browser

6. Reload the current page

7. Set initial path mappings
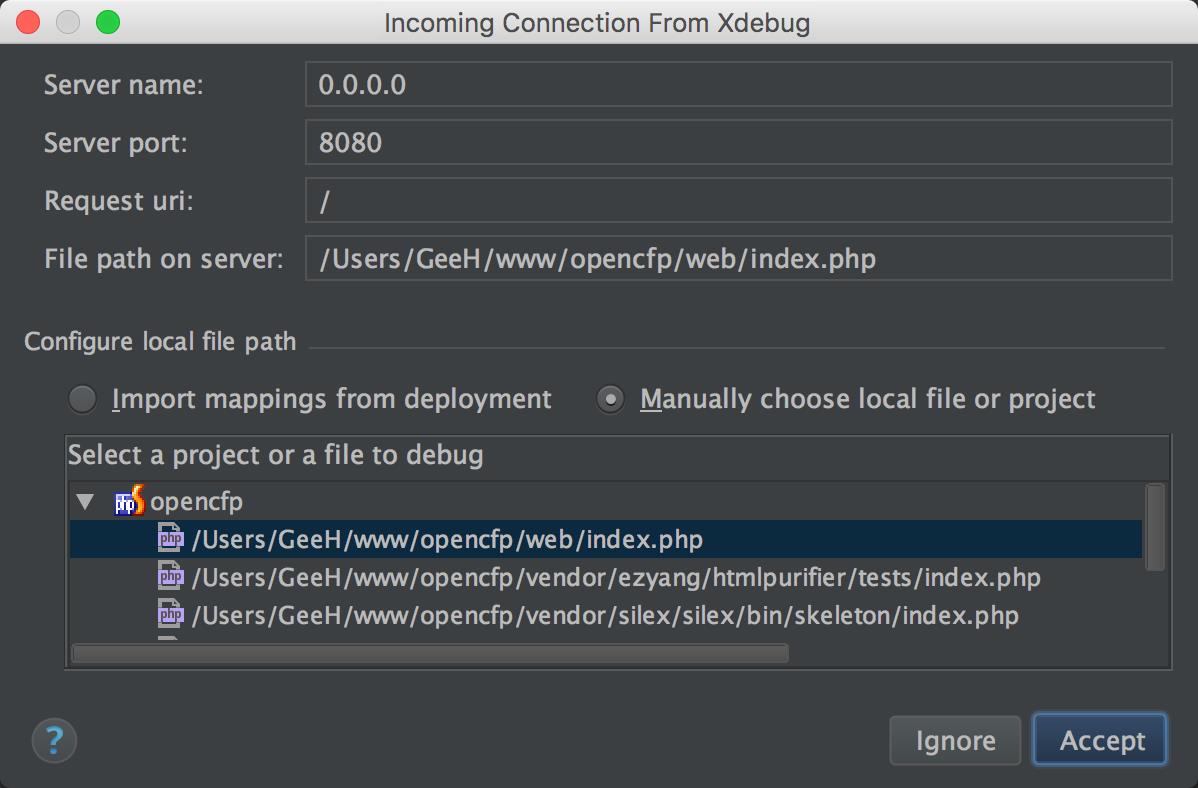
Switch to PhpStorm; you‘ll see the Incoming Connection From Xdebug dialogue. You‘ll now need to select the path mappings so that PhpStorm can map the remote files on the web server to the local files in your project. If you have a deployment configured, then PhpStorm will offer to configure the mappings based on the paths you‘ve already set in that deployment.
If you have no deployment configured (or if the file mappings in the deployment are different), then you can select a manual file to use for this incoming debugger session.

8. Debug!
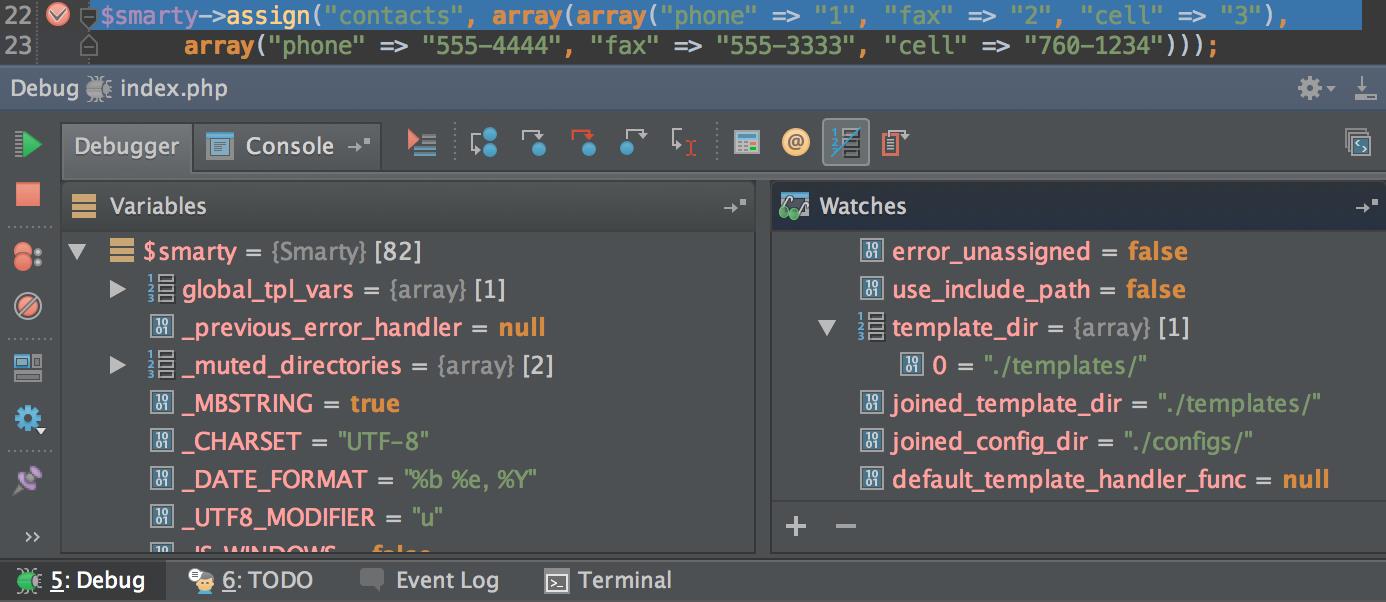
After reaching the breakpoint the debugger is suspended. Now let’s investigate the application.

Troubleshooting
The first thing to check is that the Xdebug configuration is compatible with PhpStorm‘s configuration, you can do that using the Validating Your Debugging Configuration tutorial.
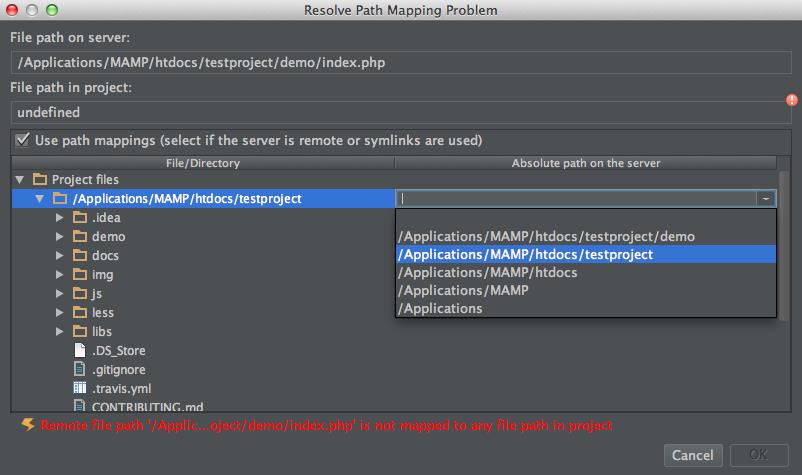
In some cases you may get the error message “Remote file path ‘path/to/script/on/the/server.php’ is not mapped to any file path in project“ or “The script ‘path/to/script/on/the/server.php’ is outside the project.” This means that PhpStorm is not sure which local file corresponds to the specified remote file path.

You can solve this problem quickly. Just set up the necessary path mappings by clicking the relevant link.

参考:https://confluence.jetbrains.com/display/PhpStorm/Zero-configuration+Web+Application+Debugging+with+Xdebug+and+PhpStorm
以上是关于ero-configuration Web Application Debugging with Xdebug and PhpStorm的主要内容,如果未能解决你的问题,请参考以下文章