安卓用canvas画曲线图
Posted 下雨天rain
tags:
篇首语:本文由小常识网(cha138.com)小编为大家整理,主要介绍了安卓用canvas画曲线图相关的知识,希望对你有一定的参考价值。
1.新建一个常变量类Constant.java
package com.rain.db;
import android.graphics.Point;

public class Constant {

	public static Point point;//获取屏幕的大小

}
2.新建一个函数ChartView.java

  1 package com.rain.kongjian;
  2
  3 import com.rain.db.Constant;
  4
  5 import android.content.Context;
  6 import android.graphics.Canvas;
  7 import android.graphics.Color;
  8 import android.graphics.Paint;
  9 import android.view.View;
 10
 11 public class ChartView extends View{
 12     public int XPoint=40;    //原点的X坐标
 13     public int YPoint=Constant.point.y/2;     //原点的Y坐标
 14     public int XScale=55;     //X的刻度长度
 15     public int YScale=40;     //Y的刻度长度
 16     public int XLength=Constant.point.x-100;        //X轴的长度
 17     public int YLength=Constant.point.y/2-100;        //Y轴的长度
 18     public String[] XLabel;    //X的刻度
 19     public String[] YLabel;    //Y的刻度
 20     public String[] Data;      //数据
 21     public String Title;    //显示的标题
 22     public ChartView(Context context)
 23     {
 24         super(context);
 25     }
 26     public void SetInfo(String[] XLabels,String[] YLabels,String[] AllData,String strTitle)
 27     {
 28         XLabel=XLabels;
 29         YLabel=YLabels;
 30         Data=AllData;
 31         Title=strTitle;
 32         XScale=XLength/AllData.length;//实际X的刻度长度
 33         YScale=YLength/YLabels.length;
 34     }
 35     @Override
 36     protected void onDraw(Canvas canvas){
 37         super.onDraw(canvas);//重写onDraw方法
 38
 39         //canvas.drawColor(Color.WHITE);//设置背景颜色
 40         Paint paint= new Paint();
 41         paint.setStyle(Paint.Style.STROKE);
 42         paint.setAntiAlias(true);//去锯齿
 43         paint.setColor(Color.BLACK);//颜色
 44         Paint paint1=new Paint();
 45         paint1.setStyle(Paint.Style.STROKE);
 46         paint1.setAntiAlias(true);//去锯齿
 47         paint1.setColor(Color.DKGRAY);
 48         paint.setTextSize(12);  //设置轴文字大小
 49         //设置Y轴
 50         canvas.drawLine(XPoint, YPoint-YLength, XPoint, YPoint, paint);   //轴线
 51         for(int i=0;i*YScale<YLength ;i++)
 52         {
 53             canvas.drawLine(XPoint,YPoint-i*YScale, XPoint+5, YPoint-i*YScale, paint);  //刻度
 54             try
 55             {
 56                 canvas.drawText(YLabel[i] , XPoint-30, YPoint-i*YScale+5, paint);  //文字
 57             }
 58             catch(Exception e)
 59             {
 60             }
 61         }
 62         canvas.drawLine(XPoint,YPoint-YLength,XPoint-3,YPoint-YLength+6,paint);  //箭头
 63         canvas.drawLine(XPoint,YPoint-YLength,XPoint+3,YPoint-YLength+6,paint);
 64         //设置字体的大小角度等
 65         paint.setTextSize(20);
 66         drawText(canvas,"单位:kWh", XPoint-5, YPoint-YLength+YScale-5, paint,-90);
 67
 68         //设置X轴
 69         paint.setTextSize(12);
 70         canvas.drawLine(XPoint,YPoint,XPoint+XLength,YPoint,paint);   //轴线
 71         for(int i=0;i*XScale<XLength;i++)
 72         {
 73             canvas.drawLine(XPoint+i*XScale, YPoint, XPoint+i*XScale, YPoint-5, paint);  //刻度
 74             try
 75             {
 76 //                canvas.drawText(XLabel[i], XPoint + i * XScale - 10,
 77 //                        YPoint + 20, paint); // 文字
 78                 drawText(canvas,XLabel[i], XPoint + i * XScale,
 79                         YPoint + 40, paint,-45); // 文字
 80                 // 数据值
 81                 if (i > 0 && YCoord(Data[i - 1]) != -999
 82                         && YCoord(Data[i]) != -999) // 保证有效数据
 83                     canvas.drawLine(XPoint + (i - 1) * XScale,
 84                             YCoord(Data[i - 1]), XPoint + i * XScale,
 85                             YCoord(Data[i]), paint);
 86                 canvas.drawCircle(XPoint + i * XScale, YCoord(Data[i]), 2,
 87                         paint);
 88             } catch (Exception e) {
 89             }
 90         }
 91         canvas.drawLine(XPoint+XLength,YPoint,XPoint+XLength-6,YPoint-3,paint);    //箭头
 92         canvas.drawLine(XPoint+XLength,YPoint,XPoint+XLength-6,YPoint+3,paint);
 93         //设置标题位置
 94         paint.setTextSize(28);
 95         canvas.drawText(Title, XLength/2-28, 50, paint);
 96     }
 97     //设置文字显示方向
 98     void drawText(Canvas canvas ,String text , float x ,float y,Paint paint ,float angle){
 99         if(angle != 0){
100             canvas.rotate(angle, x, y);
101         }
102         canvas.drawText(text, x, y, paint);
103         if(angle != 0){
104             canvas.rotate(-angle, x, y);
105         }
106     }
107
108     private int YCoord(String y0)  //计算绘制时的Y坐标,无数据时返回-999
109     {
110         int y;
111         try
112         {
113             y=Integer.parseInt(y0);
114         }
115         catch(Exception e)
116         {
117             return -999;    //出错则返回-999
118         }
119         try
120         {
121             return YPoint-y*YScale/Integer.parseInt(YLabel[1]);
122         }
123         catch(Exception e)
124         {
125         }
126         return y;
127     }
128 }
3.在需要的地方调用ChartView.java,这里在nibianqi_zt.java中调用
package com.example.myfragment;

import com.rain.kongjian.ChartView;

import com.rain.db.Constant;
import android.app.ActionBar;
import android.app.Activity;
import android.os.Bundle;
import android.view.MenuItem;

public class nibianqi_zt extends Activity {

    @Override
    protected void onCreate(Bundle savedInstanceState) {
        // TODO Auto-generated method stub
        super.onCreate(savedInstanceState);
        //setContentView(R.layout.nibianqi_zt);

        /* 显示App icon左侧的back键 */
        ActionBar actionBar = getActionBar();
        actionBar.setDisplayHomeAsUpEnabled(true);

     Constant.point = new Point();
     getWindowManager().getDefaultDisplay().getSize(Constant.point);//获取屏幕分辨率

        ChartView myView=new ChartView(this);
        setContentView(myView);
        myView.SetInfo(new String[] { "7-11", "7-12", "7-13", "7-14", "7-15",
                "7-16", "7-17" }, // X轴刻度
                new String[] { "", "50", "100", "150", "200", "250" }, // Y轴刻度
                new String[] { "15", "23", "10", "36", "45", "40", "12" }, // 数据
                "图标的标题");

    }

    // 顶部返回键
    @Override
    public boolean onOptionsItemSelected(MenuItem item) {
        switch (item.getItemId()) {
        case android.R.id.home:
            finish();
            return true;
        default:
            return super.onOptionsItemSelected(item);
        }
    }

}
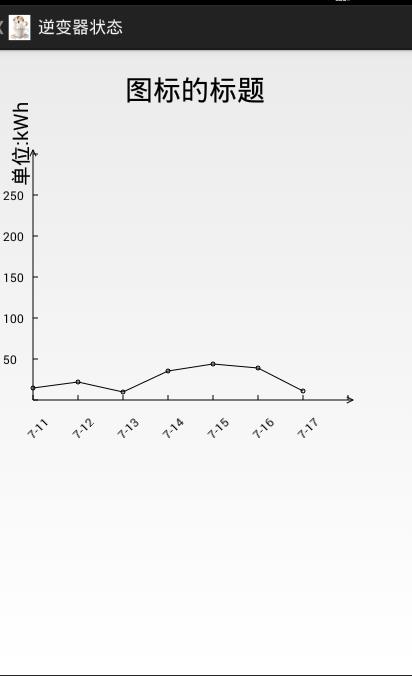
效果演示如下:

以上是关于安卓用canvas画曲线图的主要内容,如果未能解决你的问题,请参考以下文章
