jfreechart 整合sturts2牛刀小试
Posted
tags:
篇首语:本文由小常识网(cha138.com)小编为大家整理,主要介绍了jfreechart 整合sturts2牛刀小试相关的知识,希望对你有一定的参考价值。
一.增加的jar包
- struts2-jfreechart-plugin-2.1.6.jar 在struts2的相应jar包中找
- jcommon-1.0.23.jar 在jfreechart官网中找
- jfreechart-1.0.19.jar 在jfreechart官网中找
jfreechart 的相应jar包地址:http://pan.baidu.com/s/1gfygIob
相应的jsp页面:
<img src="${pageContext.request.contextPath}/jfreechart.action?id=<s:property value="vote.id"/>" />
相应的struts.xml配置:(需要注意的是头文件要改下 从箭头中的xml中引入
<package name="jfreechart" extends="jfreechart-default" namespace="/">
        <action name="jfreechart" class="jfreeChartAction">
            <result name="success" type="chart">
                <param name="width">700</param>
                <param name="height">250</param>
            </result>
        </action>
    </package>
相应的action:
package action;

import java.util.List;

import jfreechart.JfreeChartService;

import org.apache.struts2.ServletActionContext;
import org.jfree.chart.JFreeChart;

import service.SelectionService;
import service.VoteService;
import vo.Selection;

import com.opensymphony.xwork2.ActionSupport;

@SuppressWarnings ( "serial" )
public   class  JfreeCharAction  extends  ActionSupport {

    /**
     * 定 义JFreeChart对象注意在这里JFreeChart对象名只能为chart
     * http://struts.apache.org/2.x/docs/jfreechart-plugin.html
     */
    private  JFreeChart chart;

    public  JFreeChart getChart() {
        return  chart;
    }
    public   void  setChart(JFreeChart chart) {
        this .chart = chart;
    }

    private VoteService voteService  ;
    private SelectionService  selectionService ;

    public void setVoteService(VoteService voteService) {
        this.voteService = voteService;
    }
    public void setSelectionService(SelectionService selectionService) {
        this.selectionService = selectionService;
    }

    private JfreeChartService jfreeChartService ;
    public void setJfreeChartService(JfreeChartService jfreeChartService) {
        this.jfreeChartService = jfreeChartService;
    }

    private List<Selection> select_list ;

    @Override
    public  String execute()  throws  Exception {
        Integer id = Integer.valueOf(ServletActionContext.getRequest()
                .getParameter("id"));
        select_list = selectionService.find(id);
        this .chart = jfreeChartService.getChart(select_list);
        return  SUCCESS;
    }
}
相应的service:
这里的注意点是很容易出现乱码,改下font就ok
package jfreechart;

import java.awt.Color;
import java.awt.Font;
import java.util.List;

import org.jfree.chart.ChartFactory;
import org.jfree.chart.JFreeChart;
import org.jfree.chart.axis.CategoryAxis;
import org.jfree.chart.axis.ValueAxis;
import org.jfree.chart.labels.ItemLabelAnchor;
import org.jfree.chart.labels.ItemLabelPosition;
import org.jfree.chart.labels.StandardCategoryItemLabelGenerator;
import org.jfree.chart.plot.CategoryPlot;
import org.jfree.chart.plot.PlotOrientation;
import org.jfree.chart.renderer.category.BarRenderer;
import org.jfree.data.category.DefaultCategoryDataset;
import org.jfree.ui.TextAnchor;

import vo.Selection;

public class JfreeChartService {

    public  JFreeChart getChart(List<Selection> select_list){

        DefaultCategoryDataset dataset = new DefaultCategoryDataset();
        for(int i = 0 ; i < select_list.size() ; i ++){

            dataset.addValue(select_list.get(i).getNumber(),select_list.get(i).getIndex_()+"",select_list.get(i).getContent());
        }
        JFreeChart chart = ChartFactory.createBarChart("投票结果图",
                          "选项",
                          "票数(个)",
                          dataset,
                          PlotOrientation.HORIZONTAL,
                          false,
                          false,
                          false);

        CategoryPlot plot = chart.getCategoryPlot();
        //设置网格背景颜色
        plot.setBackgroundPaint(Color.white);
        //设置网格竖线颜色
        plot.setDomainGridlinePaint(Color.pink);
        //设置网格横线颜色
        plot.setRangeGridlinePaint(Color.pink);

        //显示每个柱的数值,并修改该数值的字体属性
        BarRenderer renderer = new BarRenderer();
        renderer.setBaseItemLabelGenerator(new StandardCategoryItemLabelGenerator());
        renderer.setBaseItemLabelsVisible(true);

        //默认的数字显示在柱子中,通过如下两句可调整数字的显示
        //注意:此句很关键,若无此句,那数字的显示会被覆盖,给人数字没有显示出来的问题
        renderer.setBasePositiveItemLabelPosition(new ItemLabelPosition(ItemLabelAnchor.OUTSIDE3, TextAnchor.BASELINE_RIGHT));
        renderer.setItemLabelAnchorOffset(20D);
        plot.setRenderer(renderer);


         //下面这段是防止出现乱码的
        Font font = new Font("宋体", Font.ITALIC, 12);
        CategoryAxis domainAxis = plot.getDomainAxis();//(柱状图的x轴)
        domainAxis.setTickLabelFont(font);//设置x轴坐标上的字体
        domainAxis.setLabelFont(font);//设置x轴上的标题的字体
        ValueAxis valueAxis = plot.getRangeAxis();//(柱状图的y轴)
        valueAxis.setTickLabelFont(font);//设置y轴坐标上的字体
        valueAxis.setLabelFont(font);//设置y轴坐标上的标题的字体
        chart.getTitle().setFont(font);
        return chart ;
    }

}
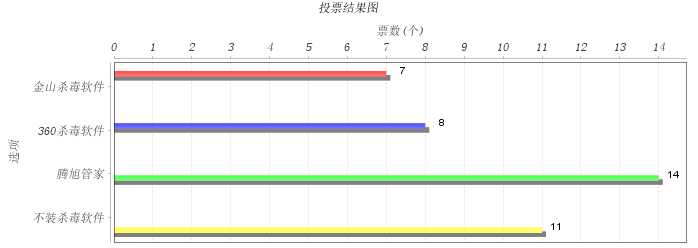
最后效果是:

以上是关于jfreechart 整合sturts2牛刀小试的主要内容,如果未能解决你的问题,请参考以下文章