pyecharts数据可视化
Posted yjh1995
tags:
篇首语:本文由小常识网(cha138.com)小编为大家整理,主要介绍了pyecharts数据可视化相关的知识,希望对你有一定的参考价值。
接上文:https://www.cnblogs.com/yjh1995/p/11836864.html
需要第三方库:
pyecharts
先贴上代码
import requests
from bs4 import BeautifulSoup
from pyecharts.charts import Bar
from pyecharts import options

#1.发送请求,获取即将上映电影
response=requests.get(‘https://movie.douban.com/cinema/later/hangzhou/‘)
html_content=response.content.decode(‘utf-8‘)
response.close()

#2.解析html格式的响应内容
soup=BeautifulSoup(html_content,‘lxml‘)
all_movies=soup.find(‘div‘,id=‘showing-soon‘)
#新建一个列表接收所有电影信息
all_movies_list=[]
for each_movie in all_movies.find_all(‘div‘,class_=‘item‘):
    tag_a=each_movie.find_all(‘a‘)
    tag_li=each_movie.find_all(‘li‘)
    movie_name=tag_a[1].text
    movie_link=tag_a[1][‘href‘]
    movie_poster=tag_a[0].find(‘img‘)[‘src‘]
    movie_date=tag_li[0].text
    movie_type=tag_li[1].text
    movie_area=tag_li[2].text
    movie_want_see=tag_li[3].text.replace(‘人想看‘,‘‘)
    #打印一下
    print(‘名字:{name},链接:{link},海报:{poster},上映日期:{date},类型:{type},地区:{area},想看人数:{want_see}‘.
          format(name=movie_name,link=movie_link,poster=movie_poster,date=movie_date,type=movie_type,area=movie_area,want_see=movie_want_see))

    all_movies_list.append({‘名字‘:movie_name,‘链接‘:movie_link,‘海报‘:movie_poster,‘上映日期‘:movie_date,‘类型‘:movie_type,‘地区‘:movie_area,‘想看人数‘:movie_want_see})

#3.用sorted将所有电影按想看的人数反序排列,x为all_movies_list中的每一个元素
all_movies_list=sorted(all_movies_list,key=lambda x:int(x[‘想看人数‘]))

#4.用pyecharts将所得数据图表化
#获取所有电影的名字和想看人数作为x、y轴
all_names=[i[‘名字‘] for i in all_movies_list]
all_lovers=[i[‘想看人数‘] for i in all_movies_list]
#设置y轴的轴间距
movie_bar=Bar(init_opts=options.InitOpts(height=‘800px‘))
#设置x、y轴
movie_bar.add_xaxis(all_names)
movie_bar.add_yaxis(‘电影关注人数‘,all_lovers,category_gap="20%")
#设置系列参数,右边显示y轴的值
movie_bar.set_series_opts(label_opts=options.LabelOpts(position=‘right‘))
#x、y轴反转
movie_bar.reversal_axis()
#将所得图标保存在文件中
movie_bar.render(‘D:\\render.html‘)
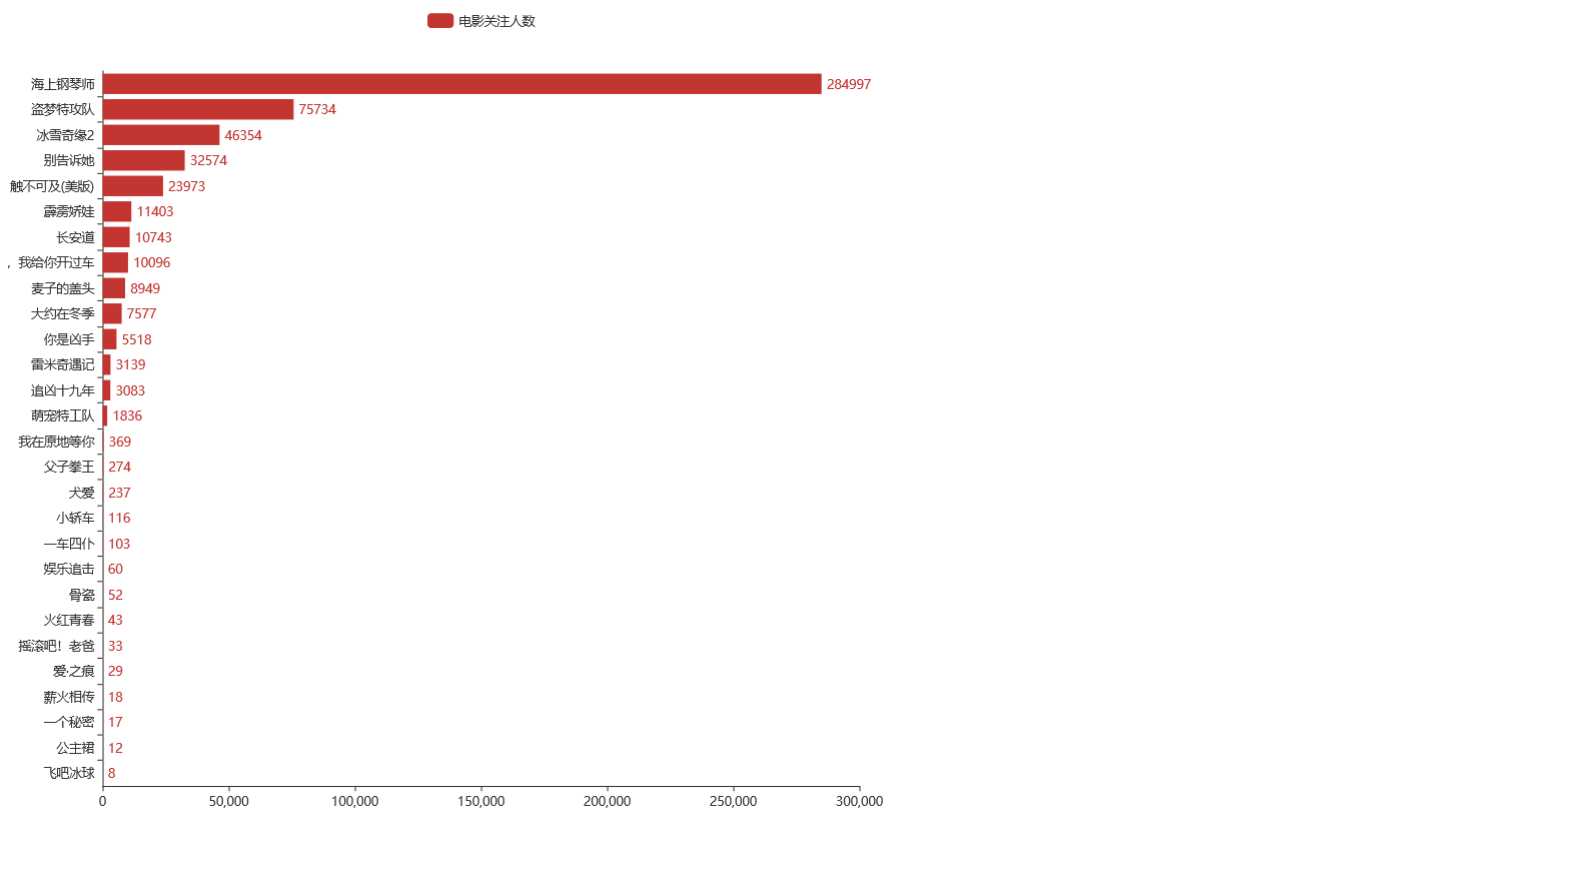
效果图

pyecharts参考链接:
https://blog.csdn.net/qq_43235685/article/details/92807207
https://pyecharts.org/#/zh-cn/demo_data
以上是关于pyecharts数据可视化的主要内容,如果未能解决你的问题,请参考以下文章